


Imagine your data as a river—it flows smoothly until something shifts, like a storm or a fallen tree, changing its course. That’s what data drift is: when the information you rely on starts to change over time.
Data drift occurs when the statistical properties of data change over time, potentially undermining the accuracy of predictive models and decision-making processes. This phenomenon, akin to a shifting foundation, can lead to unreliable outcomes if left unaddressed. In this article, we explore the concept of data drift, its causes, importance of data drift detection, and straightforward methods to detect it promptly and manage it effectively.
What is Data Drift and Why Does it Matter?
Data drift refers to changes in data distribution over time. It occurs when the statistical properties of data used to train machine learning models evolve so that the data is no longer representative of current conditions. This causes model performance to degrade.
For example, consider an e-commerce site that built a model to predict customer conversions based on past data. Over time, new trends emerge and customer behavior changes. Now the historical data used to train the original model no longer reflects the current reality. This data drift causes loss of accuracy.
The effects of data drift accumulate over time and can be very impactful if not detected and managed properly. Undetected data drift slowly erodes the reliability of machine learning systems. Microsoft reports that machine learning models can lose over 40% of their accuracy within a year if data drift is not accounted for.
Some common causes of data drift include:
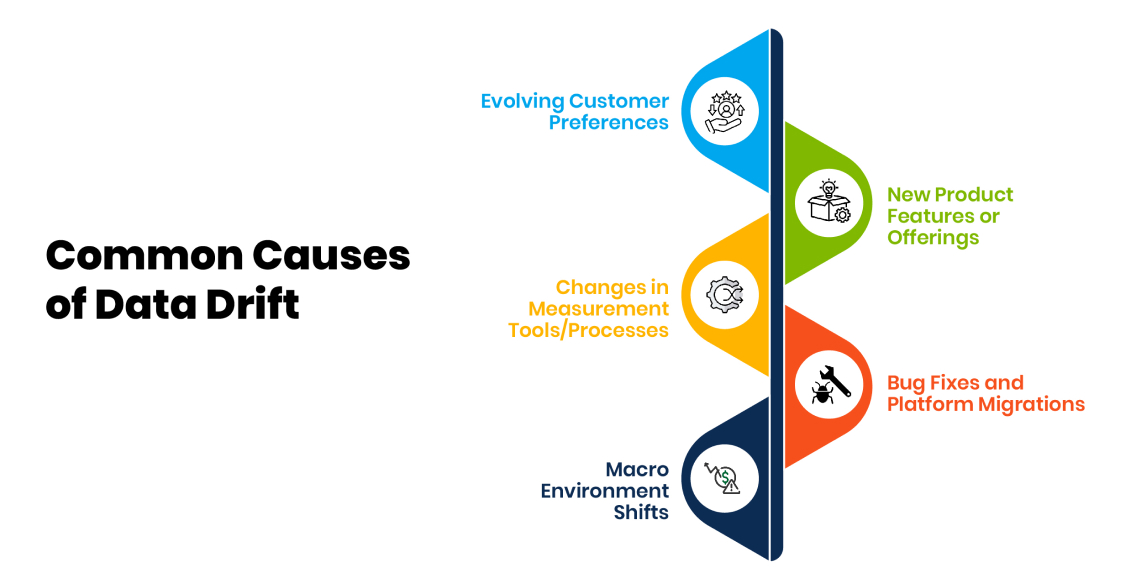
Evolving Customer Preferences
Customer preferences tend to change over time as new trends emerge, economic conditions shift, and competitive landscapes evolve. As a result, models trained on historical customer behaviors may become less accurate at predicting future behaviors. Some examples of evolving customer preferences leading to data drift include:
- Fashion and style trends that come and go, impacting purchasing behavior for clothing, accessories, home goods, etc. For instance, color palettes and silhouette preferences in women's fashion change fairly rapidly.
- Generational shifts, where younger demographics exhibit distinctly different preferences than older demographics. For example, millennials tend to prefer more casual work attire compared to previous generations.
- Changes in discretionary spending habits due to economic fluctuations. In times of prosperity, customers spend more freely while in recessions spending declines.
- The emergence of new niche preferences that gain broader appeal over time. For instance, demand for organic, plant-based, fair trade, and other value-based attributes has grown substantially in recent years.
- Increasing emphasis on experience-oriented spending rather than material goods across younger demographics. Preferences keep shifting towards travel, dining out, attending events, etc.
Evolving customer preferences are often gradual changes, making them harder to detect, but over time they can substantially alter customer behavior. Models must be retrained periodically using recent data that reflects the latest preference shifts.
New Product Features or Offerings
The introduction of new products or features can also cause data drift if these offerings significantly alter customer behavior. Some examples include:
- Technology products like smartphones frequently add new features like high-quality cameras, expanded memory, better displays, and improved processors that make customers more likely to upgrade their device.
- Streaming services adding new content or capabilities like offline viewing that increases subscriber retention.
- Vehicle manufacturers adding advanced safety features like collision warning systems and lane assist which become a priority for buyers.
- Financial service providers introducing new account options, card benefits, digital banking capabilities or interest rates that attract customers.
- Retailers launching exclusive new clothing lines, food products, or home accessories that see unusually high demand.
The appeal of new offerings tends to decay over time as they become standard. But shortly after launch, demand surges can skew data distributions. Models trained before these new capabilities launch may not predict ongoing impacts accurately.
Changes in Measurement Tools/Processes
How data is collected can also evolve over time, affecting the statistical properties. Some examples include:
- A retailer installing more accurate foot traffic counting sensors leading to higher visitor counts.
- An equipment monitoring system moving from manual spot checks to continuous automated readings, improving data coverage.
- A call center upgrading its interactive voice response system to capture more details from caller inputs.
- A bank implementing a new customer satisfaction survey methodology with more rating scale granularity.
- A delivery company putting barcode scanners in all vehicles to automatically record timings and coordinates.
When measurement approaches change, the distribution of values can shift for certain metrics. But the fundamental relationships between variables may remain intact. Understanding measurement tweaks allows models to adapt properly.
Bug Fixes and Platform Migrations
IT systems are constantly evolving, often due to bug fixes, platform migrations, or infrastructure upgrades. Some examples of how these changes might indirectly cause data drift include:
- Fixing a web analytics implementation error that underreported e-commerce conversion rates for one geography.
- Changing user account systems leading to temporary spikes in failed login attempts before customers reset passwords.
- Migrating to cloud data warehouses causing transient blips in data volumes and pipeline timings.
- Updating a mobile app notification engine, increasing opt-in rates temporarily before stabilizing.
- Enhancing page load speed through CDNs briefly skewing traffic sources as caches populate.
Engineering initiatives tend to create short-term instability though overall customer behaviors remain intrinsically the same. Identifying infrastructure changes allows models to ignore these expected anomalies.
Macro Environment Shifts
Broader economic, political, social, and technological changes can also catalyze drifts. Some examples include:
- Economic cycles like recessions that affect budgets, unemployment, inventory levels, consumer confidence, and other factors.
- Policy reforms such as healthcare acts that create entirely new market dynamics.
- Large-scale world events like the COVID pandemic massively disrupting travel, commerce, and lifestyles globally.
- New innovations like 5G networks, voice-based interfaces, autonomous vehicles, renewable energy, and quantum computing transforming industries
- Demographic shifts with boomers retiring, immigration trends evolving, household sizes declining, and urbanization increasing that change underlying population attributes.
Macro forces often transform environments gradually but unrelentingly. Though rare, acute shocks like political instability or natural disasters also cause abrupt widespread changes. Only recalibration based on recent data allows models to adapt appropriately.
Clearly, detecting and responding to data drift is critical to ensure machine learning systems continue to generate value over longer periods of time.
Types of Data Drift
Broadly, data drift is categorized into three types:
1. Covariate Shift
Covariate shift, also known as data drift, occurs when the distribution of input features changes between the training data and inference data, while the relationship between input features and target variable remains unchanged.
Some examples of covariate shift:
- In a model predicting customer churn, if the distribution of customer ages changes over time. For example, there is now a larger proportion of younger customers compared to the training data which had mostly middle-aged customers.
- For a model predicting housing prices, if the distribution of features like size of houses, number of rooms etc. changes in the new data. For example, larger houses become more common.
- In an e-commerce recommendation model, if user demographics start shifting over time, with more users from a younger age group.
Handling covariate shifts usually involves updating the model with new data that better reflects the new distributions. Techniques like weighted sampling and domain adaptation can also help adapt models to the change in input distributions.
2. Prior Probability Shift / Label Shift / Class Imbalance
Prior probability shift refers to changes in the distribution of the target variable itself, without changes in the relationship between features and target. For example, the ratio of fraud to non-fraud transactions changes over time.
Some examples:
- In a model identifying spam, if the proportion of spam emails increases over time compared to non-spam.
- In fraud detection, if the ratio of fraudulent to non-fraudulent transactions changes.
- In disease diagnosis, if the share of positive or negative cases changes.
This drift specifically affects models that make predictions based on the frequency of different labels. Strategies like resampling the training data, generating synthetic data, and adjusting decision thresholds can help address class imbalance.
3. Concept Drift
Concept drift refers to changes in the relationship between input features and the target variable itself. In other words, the fundamental associations that the model relies upon change over time.
Some examples of concept drift:
- In a sentiment analysis model, if people start using different words to express positive or negative emotions.
- In customer churn models, if different factors (age, location etc.) start influencing churn over time.
Concept drift is usually trickier to handle since the core assumptions made by models are impacted. Broadly, the strategies are - continuously monitoring and updating models with relevant data, having mechanisms to detect drift, and retraining models periodically. Ensemble models trained on different time periods can also help withstand concept drift.
Handling concept drift needs understanding of how user behavior and relationships evolve, and monitoring if model performance drops accordingly.
Detecting Data Drift
The first step is detecting when data drift starts impacting model accuracy. There are three main approaches for monitoring and data drift detection:
1. Visual Inspection
Visual inspection of data is an intuitive starting point for detecting data drift. By plotting the distributions of features over time, data scientists can visually identify shifts that may indicate drift. Specific approaches include:
- Plotting histograms of feature values over multiple time periods to spot distributional shifts.
- Tracking summary statistics like means and variance over time to spot more gradual drifts.
- Creating multivariate plots to inspect relationships between features.
However, visual inspection has some limitations:
- It may not easily expose complex relationships between features.
- Tracking high-dimensional data visually becomes infeasible.
- There is a risk of missing drifts due to human error and subjectivity.
Overall, visual inspection is a useful basic check for drift, but should be supplemented with more rigorous statistical tests.
2. Statistical Tests
Statistical tests provide a quantitative and objective way to detect differences between data distributions over time. Some common statistical tests for identifying data drift are:
- Kolmogorov-Smirnov (K-S) test: Compares cumulative distributions of two samples to quantify distance between them.
- Chi-squared test: Checks distribution of categorical variables between two samples.
- T-test: Compares means between two samples to check for statistical difference.
These tests output a p-value measuring the statistical significance of the difference between the distributions. If the p-value is lower than a threshold, we can reject the null hypothesis that the distributions are the same and conclude that drift is present.
The choice of statistical test depends on computational efficiency, ease of calculation, and sensitivity towards detecting shifts in different distribution types.
3. Model Performance Metrics
In addition to statistical tests on data, monitoring machine learning model performance metrics can provide assurance that models continue to perform well in production. Relevant metrics to track include:
- Accuracy
- AUROC
- Precision
- Recall
If these metrics start decreasing substantially over time, it may indicate that drift is beginning to impact the model's predictive power.
The limitation of model metrics is that they can only confirm drift retroactively after model performance drops. However, model monitoring may already be part of model ops pipelines, making this an easily accessible drift check.
Strategies for Handling Data Drift
Once data drift has been detected, here are some effective strategies to handle it:
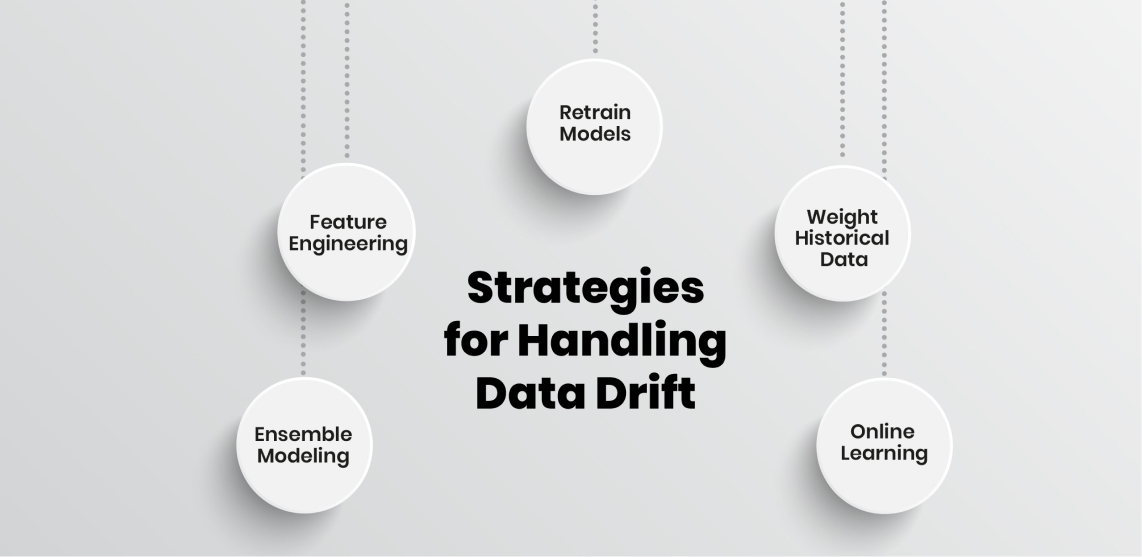
Retrain Models
The simplest approach is to retrain models on recent datasets reflecting current data patterns. Retraining restores accuracy but models need to be redeployed.
Weight Historical Data
Instead of discarding old data, apply less weight to older data when retraining models. This smooths the effects of drift while still leveraging historical patterns.
Online Learning
Some algorithms like regression trees support online learning where models are updated incrementally as new data arrives. This way, adaptation happens continuously.
Ensemble Modeling
Train separate models on data from different time periods then combine them into an ensemble. Ensembles automatically balance between historical and recent patterns.
Feature Engineering
Evolve feature engineering pipelines by adding features that capture new latent data patterns and removing obsolete features. This aligns model inputs with reality.
The appropriate handling approach depends on the use case and availability of resources. The combination of continuous monitoring to detect drift plus periodic adaptation using strategies like retraining enables keeping machine learning models accurate even as data evolves. With rigorous drift management practices, production systems can stay reliable over long periods.
Conclusion
Data drift is a significant threat to the longevity of machine learning systems. Unmanaged drift leads models to become unreliable over time, silently accumulating inaccuracy. But understanding causes of drift, implementing detection practices, and applying drift adaptation strategies allows the system accuracy and reliability to be maintained. Disciplined drift management unlocks huge value by preventing performance degradation over months and years.


