Statistical analysis is a key tool for processing raw data into intelligible insights that serve in the making of decisions in all fields of business, research, and health. Since the importance of using the right statistical methods and applying effective statistical techniques depends on the increasingly data-driven approach to solving the problems faced by organizations, it has never been as important as it is today. In this article, we lay out the vital steps, methods, and techniques that undergird robust data analysis, helping professionals feel confident in their decisions based on data.
Defining Objectives and Gathering Data: The First Steps in Effective Analysis
The first critical step of statistical analysis is to have the right data and define clear objectives. The entire process has its foundation in this phase, so the analysis is centered and still relevant.
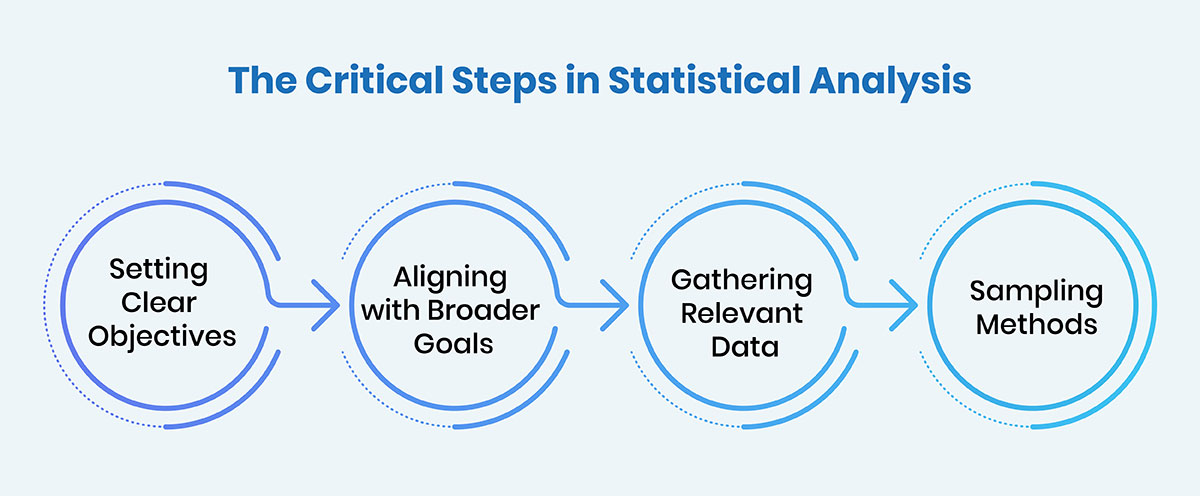
- Setting Clear Objectives: The first thing before diving into data is knowing what you want to achieve. Are you testing a hypothesis, exploring patterns, or are you making predictions? Statistical methods and techniques are chosen based on clear objectives which steer you right through the process.
- Aligning with Broader Goals: Make sure that the analysis objectives have a direct correlation to overarching business or research objectives. It allows for direct alignment with decision-making for targeted insights.
- Gathering Relevant Data: The data collected should be purposeful—directly supporting the analysis objectives. It could be through either collecting primary data, survey or experimental, or secondary data from an existing database or studies.
- Sampling Methods: Select proper sampling approaches to guarantee the data are reflective of the population under study, thereby diminishing biases and expanding the reliability of the findings.
Data Preparation: Cleaning and Organizing for Accuracy
Preparation of the data to the point where an effective statistical analysis can be done is essential. The quality of the data is very important to the analysis’ accuracy and reliability. The first step is to clean and transform the data to make it ready for meaningful insights.
Data Cleaning and Transformation
- Handling Missing Data: It is very important to identify and manage missing values with methods such as imputation or deletion. Mean substitution or some predictive algorithms are also commonly used.
- Outliers Detection: It is important to identify outliers that can lead to results. Box plots, z scores, etc. help you identify extreme values that need to be corrected.
- Normalization and Standardization: This allows for the comparability of the variability of the variables since all variables are transformed to a common scale (z scores or Min-Max scaling).
Data Structuring for Analysis
Structured data can help make it easier to perform statistical analysis by organizing data into formats such as tables or data frames. It also involves making sure that all variables are categorized properly, that numeric values are in the correct format, and that data does not contain errors or redundancies. Managing large datasets with effectiveness requires SSL and tools such as R, Python or SQL can be used.
Choosing Appropriate Statistical Methods for Analysis
In any data analysis project, it is very important to select the right statistical methods. While the choice of technique will vary greatly from research to research, depending on the nature of the data and the inferences you want to draw, it will however largely depend on your research objectives.
Descriptive Statistics
Before we look at more advanced statistical techniques to analyze data, descriptive statistics provide baselines for understanding and summarizing data. The central tendency measures, such as mean, median, and mode, and dispersion measures like standard deviation and variance tell you about a dataset in a way that highlights significant patterns.
- Mean, Median, Mode: It includes Central tendency measures that summarize the typical value in a dataset.
- Standard Deviation: It indicates the spread or distribution of the data points (graph).
- Skewness and Kurtosis: Check the distribution of data to see whether it is set in symmetry and peakedness.
Inferential Statistics
By using inferential statistics, analysts can generalize or predict a whole population out of a sample. All of which involves hypothesis testing, finding confidence intervals, and determining the significance of results. These methods allow for quantification of uncertainty and if any patterns we observe in the data are statistically significant.
- Hypothesis Testing: This is used to know if there is enough evidence to support or not to reject a hypothesis.
- Confidence Intervals: Give a range of values, within which the true population parameters are likely to fall.
- P-Values: A method used to assess the strength of evidence in favor of a null hypothesis.
Predictive Modeling and Regression Analysis
Regression analysis and other predictive modeling techniques are used to describe the relationships between variables and to make predictions. Linear regression is used to find out the trends while logistic regression is used to classify the problems.
Advanced Statistical Analysis Techniques for Complex Datasets
Statistical analysis techniques are advanced and crucial for deriving insights from large and complicated datasets spread over various variables or at different times. Here are three prominent methods:
- Multivariate Analysis: This is an important technique for studying relationships inside datasets having more than one variable. Analysts can use the methods, parameterized by factor analysis, cluster analysis, and principal component analysis (PCA), to reduce data complexity, discover patterns, and identify influential key factors, however, without having to sacrifice the integrity of the data. Each method offers unique insights: In factor analysis, underlying variables are uncovered; cluster analysis groups similar data points, and PCA reduces dimensionality.
- Time Series Analysis: An analyst using time series analysis can analyze data points taken or recorded at successive time intervals. It is widely used to forecast time trends, seasonal patterns, or cyclical movements in the data. Moving averages are techniques to smooth out fluctuations, the ARIMA (AutoRegressive Integrated Moving Average) model helps you to predict future values. The data is further broken down into trend, seasonal, and residual components by seasonal decomposition to provide greater clarity.
- Bayesian Statistics: Bayesian statistics are fantastic for updating probabilities as data continues to appear. Since belief updates happen based on prior knowledge as well as observed data, it is particularly well suited for the case of an environment with uncertainty. The support for decision-making is provided by this technique with dynamically evolving insights that are updated appropriately to changes in real time.
Ensuring Statistical Validity and Reliability in Analysis
The reliability and validity of statistical analysis are very critical to ensuring analysis outcomes are credible. The term validity refers to how good the conclusions are that we made from the data and the term reliability means how consistent these results are across different tests.
Key aspects of validity include:
- Internal validity: It makes the study truly reflect that which exists in a relationship between variables: free from confounding factors.
- External validity: Decides whether what is found can be applied to similar groups or locations.
Reliability can be improved through:
- Test-retest reliability: Repeating the analysis under similar conditions to check consistency.
- Inter-rater reliability: Determine whether it will yield uniform results when multiple analysts are to do the study.
Necessary data collection, thorough analysis, and stringent methodological checks are required to maintain both validity and reliability in meaningful work. If analysts follow these principles, they can produce results that are both trustworthy and actionable.
Tools and Software for Conducting Effective Statistical Analysis
Statistical analysis is heavily relied on these days, which is why selecting the right tools is very important. There are several options in software to suit different types of analysis from basic statistical methods to advanced predictive modeling.
Data Analysis Tools that are popular
- Python: One of the most widely used, because of its flexibility and the extensive traditional libraries (NumPy, pandas, and SciPy) that make it easy to manipulate and analyze data. It’s great for doing your custom scripting and integration with machine learning algorithms.
- R: Famous for the abundant number of statistical analysis techniques and its excellent graphical capabilities. For statistical modeling, hypothesis testing, and supervised or unsupervised data visualization, R is often used.
- SAS: An advanced analytics tool, a powerful tool, designed for statistical modeling, data mining, and forecasting. In healthcare or finance, because of its high reliability, SAS is usually in use.
Automation and AI in Statistical Analysis
- RapidMiner: It is a data science platform that uses a combination of statistical methods alongside machine learning to automate workflows. It is particularly useful in streamlining repetitive tasks by improving efficiency.
- Tableau: A content visualization tool, Tableau provides analytic functions and interfaces with R and Python which greatly enhances its use as a mixed visual representation and analysis tool.
Depending on how complex your dataset is and what you want to analyze with the data, the tool you select depends on its capabilities. The tools have different strengths, and analysts can choose the one best suited for their goal.
Conclusion
Statistical analysis is an essential tool in today’s data-driven world when making informed decisions. Using structured statistical methods and advanced statistical analysis organizations to extort value insights and formulate strategic actions. Automation and the rise of AI are also accelerating analytical efficiency, empowering professionals with the ability to manage a difficult dataset with precision. Keeping up with the dense body of knowledge in the field is important because the field is changing rapidly, and you want to have the latest trends and tools as they emerge.


