


Regression analysis is a statistical method used widely in data science and machine learning to understand the relationship between variables and make predictions. As data volumes grow exponentially, regression analysis plays a vital role in extracting meaningful insights. This article aims to provide a comprehensive overview of regression techniques in data science.
What is Regression Analysis?
Regression analysis is a predictive modeling technique used to understand the relationship between a dependent or target variable and one or more independent variables. It allows us to measure the strength of the relationship between variables and forecast the value of the dependent variable based on the independent variable.
In simple terms, regression analysis helps find out the cause-and-effect relationship between variables. For example, a marketer may use regression to understand how the advertising budget (independent variable) impacts sales (dependent variable).
The goal of regression modeling is to select variables that best predict the target variable and establish the form of relationships between them. This helps analyze past data to make predictions for new observations.
Why Use Regression Analysis?
There are several benefits of using regression analysis:
- Understanding relationships: It indicates the impact of independent variables on the dependent variable and the strength of each relationship.
- Prediction: Regression models derived from analyzed data can be used to predict future outcomes based on values of independent variables.
- Forecasting: By analyzing trends from past observations, regression allows forecasting dependent variable values over time.
- Insight generation: Regression output helps identify key drivers that influence the target variable and their nature of impact - positive, negative etc.
- Decision making: Organizations across domains like finance, marketing, and healthcare rely on regression findings for critical decisions involving resources, budgets etc.
- Comparison of effects: Regression permits comparing the influence of factors measured on different scales, such as price vs promotion.
- Causal Analysis: Under certain conditions like no multicollinearity, regression can study causative relationships between variables.
In essence, regression analysis is pivotal to evidence-based data-driven decision-making and predictive analytics, making it a fundamental technique in data science.
Types of Regression Models
Several regression models exist based on data types and relationships. The key ones are:
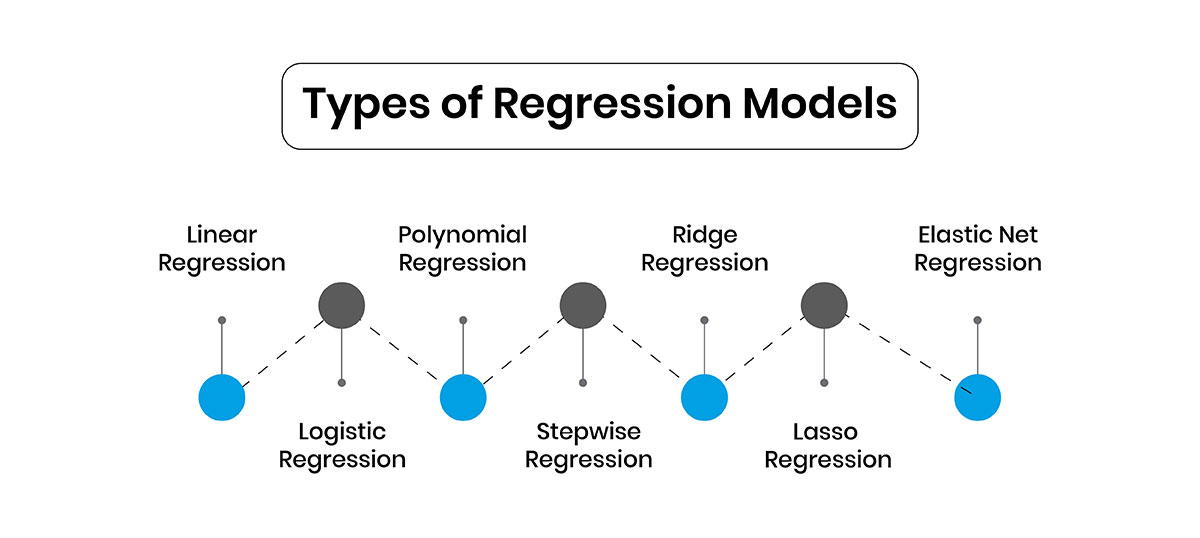
Linear Regression
Used when the dependent variable is continuous and its relationship to independent variables is linear i.e. straight-line. It assumes a linear equation of the form:
y = b0 + b1x1 + b2x2 +.....+bnxn
Where, y is the dependent variable, x1 to xn are independent variables, and b0 to bn are coefficients.
linear regression has one independent variable while multiple linear regression deals with multiple variables. It is the basic and most widely used regression technique.
Logistic Regression
Applicable when the dependent variable is categorical with two possible outcomes (binary/dichotomous) like True/False, Yes/No etc. It establishes the relationship between predictor variables and the log odds of these categorical outcomes.
The output is a probability value between 0 & 1. It is used popularly for classification problems.
Polynomial Regression
Used when the actual relationship between variables is non-linear i.e. not a straight line but a curve. It fits polynomial i.e. quadratic, cubic etc. terms of independent variables in the model to capture such relationships.
Stepwise Regression
A semi-automated process that adds/removes variables to the model based on statistical criteria like significance. Both forward and backward stepwise exist and it helps select the most influential predictors.
Ridge Regression
Used for estimating regression coefficients when multicollinearity is present, as it adds a factor proportional to the square of coefficients as a penalty term. This shrinks coefficients to improve the model.
Lasso Regression
Similar to Ridge but uses an L1 regularization/L1 norm penalty which drives some coefficients to exactly zero, achieving feature selection too in the process. Useful for high-dimensional data.
Elastic Net Regression
Combines L1 and L2 regularization of Lasso and Ridge respectively, to simultaneously do automatic variable selection and continuous shrinkage of coefficients.
These are the major regression techniques in data science implemented for various predictive modeling problems. The choice depends on data types, relationships involved and goals.
Key Steps in Conducting Regression Analysis
Regression analysis follows a structured process irrespective of the model used. Here are the steps of regression analysis:
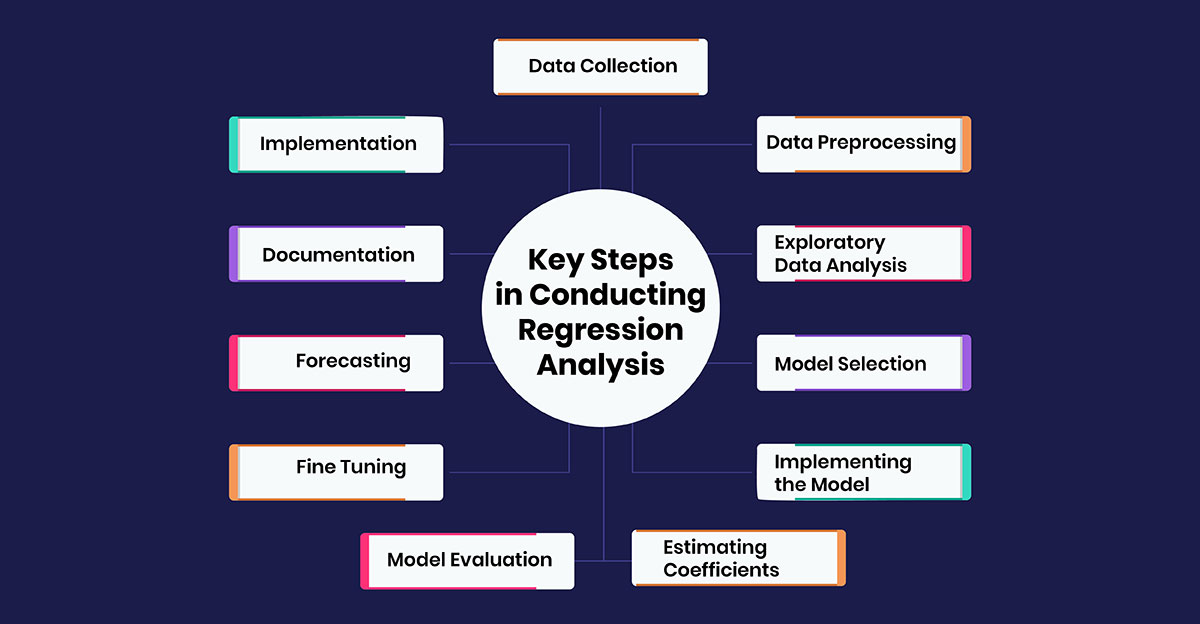
Data Collection
The first step involves collecting relevant historical data from available sources. This raw data contains records of all the variables that may potentially impact the target variable. For example, in predicting sales of a product, data on factors like price, advertisements, competitors' prices, economy, weather etc. over past time periods will be gathered. The dataset should have complete information for both the independent variables and the dependent variable.
Data Preprocessing
Once the raw data is collected, it goes through preprocessing steps. Here, the data is cleaned by removing noise and inconsistencies. Any missing value records are either removed or imputed using statistical techniques. Variables may also be transformed to satisfy model assumptions like normality, linearity etc. Outliers are treated by either removing or bringing them closer to the data range using methods like winsorization, capping etc. The preprocessed data is now ready for analysis.
Exploratory Data Analysis
In this step, the data distribution and patterns are explored by visualizing variables and checking correlations. Plots like histograms and boxplots help identify outliers and understand variable distributions. Correlation matrices and scatter plots indicate correlated, linearly related variables respectively. This analysis gives insights into variable transformations needed and relationships that exist in the data.
Model Selection
Based on the variable types observed in Exploratory Data Analysis (EDA), an appropriate regression model is identified. For example, if the target variable is continuous, linear regression can be selected. If the nature of the relationship between variables is quadratic, polynomial regression may be suitable. Parameter optimization techniques like regularization are used if multicollinearity exists between independent variables.
Implementing the Model
The selected regression algorithm is applied to the preprocessed data to fit a model. In linear regression, the coefficients for the independent variables are estimated to generate the best-fit linear equation to describe the target-feature relationship. Similar to other regression techniques, the model parameters are derived.
Estimating Coefficients
In this step, the estimates or numeric values of coefficients corresponding to each independent variable in the regression equation are calculated. Using optimization techniques like gradient descent, the coefficient values are iteratively determined which produces minimum prediction error for the model on training data.
Model Evaluation
Various statistical measures are used to evaluate how well the fitted model performs. R-squared indicates what percentage of variability in the target can be explained by the model. RMSE(Root Mean Square Error) and MAE(Mean Absolute Error) indicate average prediction errors. These measures along with cross-validation ensure the model is evaluated on its generalization capability and not just on train data it was fit on.
Fine Tuning
If required, the final model's performance is improved through fine-tuning. By transforming variables, removing less significant variables, and treating outliers differently, the model accuracy can be enhanced. Hyperparameter optimization can refine the model complexity to avoid under and overfitting.
Forecasting
Once fine-tuned, the regression model is used to predict target variable values for fresh, previously unseen data, to check how well it forecasts. This enables validating the applicability of patterns identified in the analysis of new real-world data.
Documentation
All the steps involved, types of models evaluated, variables and patterns identified, and model metrics are properly recorded in the documentation. This serves as a reference for future analysis with the same or extended datasets.
Implementation
The insights and relationships revealed through regression analysis are interpreted to define strategies and action plans to be implemented. In the sales example, a marketing budget may be allocated specifically targeting demographics and seasons identified to positively impact sales. Regression thus facilitates evidence-based decision-making.
This generalized workflow should be followed to carry out effective regression using suitable techniques.
Common Tasks in Regression Analysis
Besides the standard steps, there are certain recurring tasks in typical regression modeling engagements:
- Variable Selection: As not all available variables significantly impact the target, methods like correlation analyze the influence and stepwise exclude unnecessary inputs.
- Multicollinearity Detection: Strong relationships between independent variables should be identified and resolved through standardization, dummy coding or feature extraction techniques.
- Non-Linear Relationships: If linear regression assumptions are violated, polynomials or other transformations of variables make relationships linear again.
- Outlier Treatment: Atypical observations far from the data’s general distribution are either removed or modified to prevent them from misleading the model.
- Missing Data Imputation: Techniques like mean imputation fill absent values so complete records can be used effectively without reducing sample size.
- Model Validation: To prevent overfitting, cross-validation, and hold-out sets separate from training data evaluate generalization capability.
- Hyperparameter Tuning: Choices of model configuration like polynomial degree, and regularization strengths require optimization for accuracy.
- Ensemble Methods: Techniques like bagging and boosting average outcomes from multiple regression models to improve stability and performance.
Addressing such challenges comprehensively delivers high-fidelity regression solutions in real applications.
Sample Projects Using Regression
To understand concepts better, here are some sample projects applying regression techniques:
- Housing Price Prediction: Analyze house attributes to build a linear model estimating prices using Boston housing data.
- Marketing Campaign Analysis: Use past campaign details and sales logs to logistic regression model estimating campaign success probabilities.
- Stock Price Forecasting: Collect historical stock performance figures and develop polynomial models for quarterly return forecasting.
- Bike Rental Demand Estimation: Acquire weather and seasonal data, and apply multiple linear regression estimating hourly demand for bike rentals.
- Insurance Premium Modeling: Develop stepwise models analyzing customer profiles and claim records to determine adequate premiums based on risks.
- College Admission Analysis: Apply ensemble methods on student attributes and entrance scores to regression predictions for the probability of graduating.
- Online Ad Effectiveness: Measure linear or polynomial relationship between ad expenditure and website traffic/sales through regression on digital marketing analytics.
Such guided application projects based on public datasets help cement conceptual learning from an implementation perspective.
Limitations of Regression Analysis
While regression modeling provides useful predictive capabilities, some limitations must be considered:
- Causation cannot be proven, only association is established between variables statistically.
- Valid only for populations similar to the sample used to develop the model.
- Assumes a linear relationship but behavior may be non-linear in reality requiring transformation.
- Statistical significance does not guarantee the practical or economic significance of influential variables.
- Over-reliance on a single model ignores uncertainty throughout the process from data to inferences.
- The impact of new unobserved variables is difficult to account for in historic predictive modeling.
- Correctly specifying independent variables affecting the target is challenging without domain expertise.
- Rare categories in categorical target variables cannot be predicted reliably with limited observations.
Hence regression must be applied judiciously and validated considering its limitations in making real-world predictions and decisions. Combining domain knowledge enhances analysis.
Conclusion
In conclusion, regression analysis techniques are important tools used in data science to model and analyze relationships between variables. Each technique has its own strengths and use cases depending on factors like the number of variables, type of dependent variable, and shape of the relationship. Selecting the appropriate regression model requires understanding the data properties and evaluating different models. Overall, regression analysis is a core concept in machine learning and predictive modeling that is widely applied across different domains.


