As data becomes increasingly integral to decision making across diverse fields, gaining accurate and reliable insights from Data Analysis is more important than ever. While analytical techniques provide powerful means for assessing trends, relationships and patterns in data, some atypical observations known as outliers can significantly skew results if not properly addressed. This blog post discusses outliers - what they are, why they matter, and how to detect Outliers.
What are Outliers?
Outliers refer to observations in a dataset that diverge noticeably from other data points. They do not conform to the general data pattern due to variability in measurements, errors or genuine rarities. To qualify as an outlier, a data point must be sufficiently distant from the rest of the values in the sample. Simply put, outliers are anomalies that fall outside the expected range for a given variable.
Some key characteristics of outliers include:
- They greatly differ from other observations numerically.
- Their presence can alter statistical conclusions such as the mean or median.
- They arise due to genuine variability, measurement errors or data entry mistakes.
- They represent rare occurrences relative to the full data population.
Whether included, excluded or further investigated, taking an informed approach to outlier detection in data analysis is crucial for analytics quality.
Why Detecting Outliers Matters?
There are several reasons it is important to detect Outliers in Data Analysis:

-
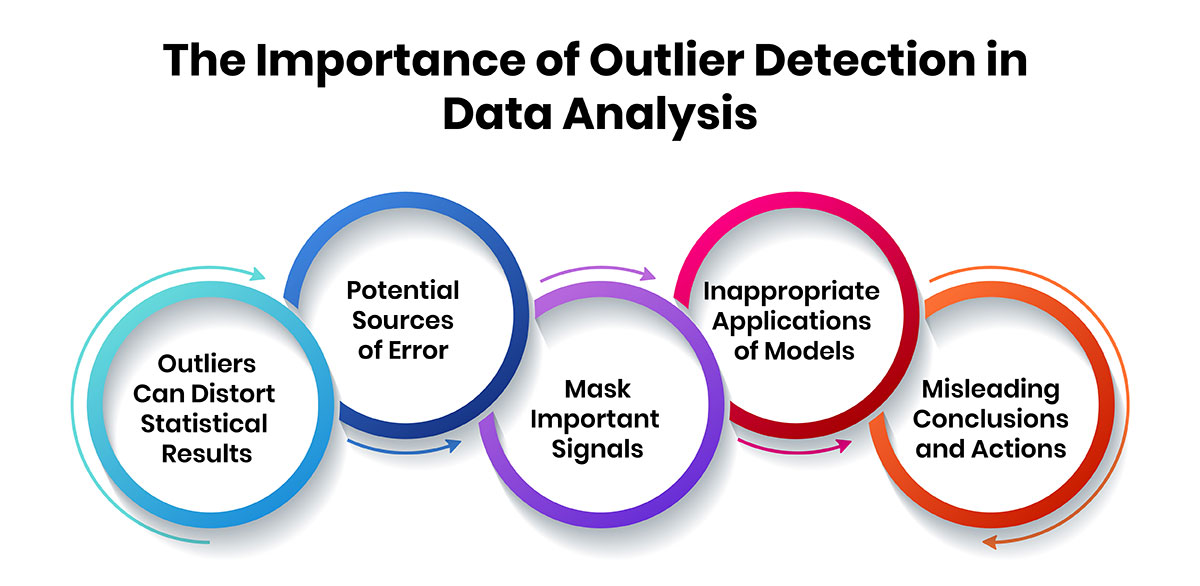
Outliers Can Distort Statistical Results
Since many analytical techniques rely on measures of central tendency like mean, outliers with extreme values can unduly influence calculations. This distorts patterns and underestimates variation in the overall data distribution. -
Potential Sources of Error
Outliers may stem from systematic errors in measurement tools, data entry mistakes or invalid data points. Ignoring their impact can undermine the reliability of analysis based on flawed data. -
Mask Important Signals
In some cases, outliers are actually important signals meriting deeper inspection. For example, they could indicate emerging trends, atypical customer behaviors or defects in industrial processes. Ignoring them risks missing valuable insights. -
Inappropriate Applications of Models
The presence of outliers can violate assumptions required by different statistical tests and modeling techniques. This leads models to produce spurious or inadequate results with outliers included. -
Misleading Conclusions and Actions
Distorted analysis due to outliers may result in inaccurate or implausible conclusions, steering wrong policy or business decisions. This wastes resources and creates inefficiencies.
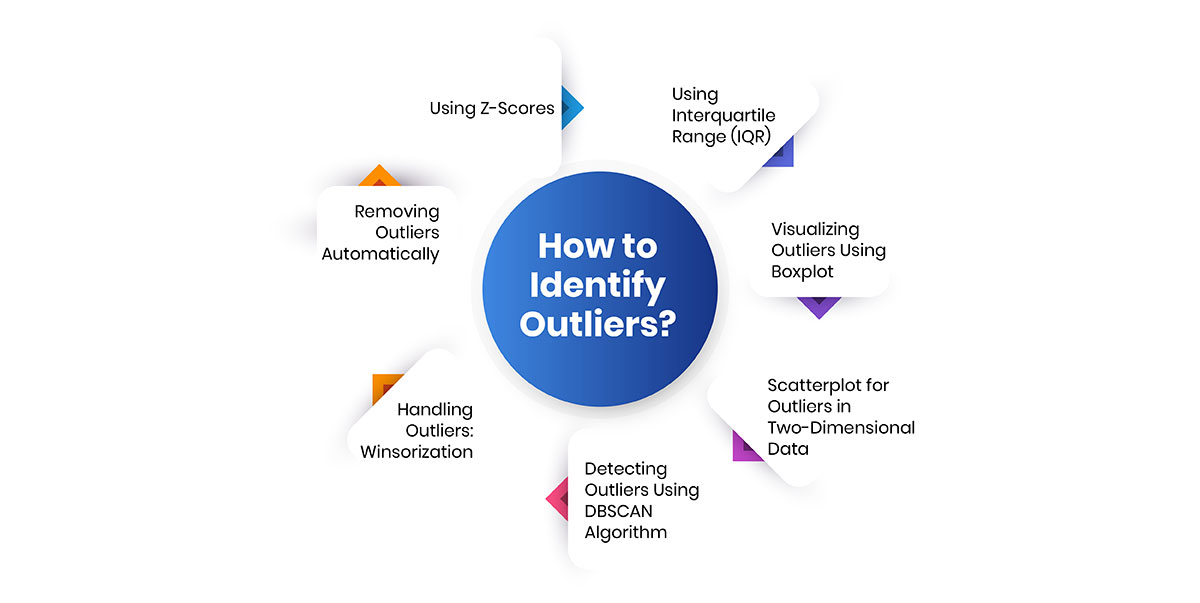
How to Identify Outliers?
Given their potential to skew results, detecting outliers is a paramount early step in the data preparation phase. Some effective visualization and statistical techniques include:

-
1.Using Z-Scores
The Z-score method detects outliers by measuring how far away a data point is from the mean in terms of standard deviations.
import numpy as np
import pandas as pd
from scipy import stats# Sample dataset
data = pd.DataFrame({'Values': [10, 12, 13, 15, 100, 20, 22, 25, 26]})# Calculate z-scores
data['Z_Score'] = np.abs(stats.zscore(data['Values']))# Identify outliers (z-score > 3)
outliers = data[data['Z_Score'] > 3]
print("Outliers using Z-scores:\n", outliers) -
2.Using Interquartile Range (IQR)
The IQR method defines outliers as any data point outside 1.5 times the IQR range (between the 1st and 3rd quartiles).
# Calculate Q1 (25th percentile) and Q3 (75th percentile) Q1 = data['Values'].quantile(0.25)
Q3 = data['Values'].quantile(0.75)
IQR = Q3 - Q1# Determine outliers based on IQR lower_bound = Q1 - 1.5 * IQR
upper_bound = Q3 + 1.5 * IQR
outliers_iqr = data[(data['Values'] < lower_bound) | (data['Values'] > upper_bound)]print("Outliers using IQR:\n", outliers_iqr)
-
3.Visualizing Outliers Using Boxplot
Visualizing outliers is a quick way to spot them. Boxplots highlight outliers as dots outside the whiskers.
import matplotlib.pyplot as plt
import seaborn as sns# Create a boxplot to visualize outliers
plt.figure(figsize=(8, 6))
sns.boxplot(x=data['Values'])
plt.title("Boxplot for Outlier Detection")
plt.show() -
4.Scatterplot for Outliers in Two-Dimensional Data
Scatterplots are useful for visualizing relationships and detecting outliers when working with two variables.
# Scatterplot of two variables to detect outliers
data_2d = pd.DataFrame({
'X': [10, 12, 13, 15, 100, 20, 22, 25, 26],
'Y': [30, 32, 35, 36, 150, 40, 42, 45, 48]
})plt.figure(figsize=(8, 6))
plt.scatter(data_2d['X'], data_2d['Y'])
plt.title('Scatterplot for Outlier Detection')
plt.xlabel('X')
plt.ylabel('Y')
plt.show() -
5.Detecting Outliers Using DBSCAN Algorithm (Density-Based Spatial Clustering of Applications with Noise)
The DBSCAN algorithm is a clustering method that can be used to detect outliers, especially in multi-dimensional data.
from sklearn.cluster import DBSCAN
import numpy as np# Sample 2D data
X = np.array([[10, 30], [12, 32], [13, 35], [15, 36], [100, 150], [20, 40], [22, 42], [25, 45], [26, 48]])# Fit DBSCAN model
dbscan = DBSCAN(eps=3, min_samples=2)
dbscan.fit(X)# Identify outliers (labeled as -1)
outliers_dbscan = X[dbscan.labels_ == -1]
print("Outliers using DBSCAN:\n", outliers_dbscan) -
6.Handling Outliers: Winsorization
The Winsorization technique reduces the influence of outliers by capping extreme values.
from scipy.stats import mstats
# Winsorize the data (limits set at 5th and 95th percentiles)
winsorized_data = mstats.winsorize(data['Values'], limits=[0.05, 0.05])print("Winsorized Data:\n", winsorized_data)
-
7.Removing Outliers Automatically
If outliers are clearly errors, they can be removed from the dataset.
# Remove outliers based on z-scores
cleaned_data = data[data['Z_Score'] <= 3]
print("Cleaned Data without Outliers:\n", cleaned_data)
The approach used depends on factors such as the nature, size and dimensionality of data. Multiple checks aid robust identification by cross-validating outliers across techniques.
Managing and Addressing Identified Outliers
Once outliers are detected, addressing them suitably maintains soundness of analysis. Some common options include:
-
Remove Outliers
If through exploration it is determined that outliers stem from clear and obvious errors in data collection or reporting, then removing them from the dataset is an appropriate response. This approach retains the integrity of the overall data by excluding values that are known to be invalid or incorrect. However, care must be taken to only remove outliers that have been conclusively identified as errors, and to properly document which data points were removed and the reasoning. Simply removing outliers solely because they are extremes can distort the true representation and introduce bias. Removal is best suited for cases where inclusion of the outlier would have an outsized influence on overall patterns, averages or statistical models due to being far from the general distribution. -
Winsorize Outliers
An alternative to full removal is to apply winsorization, which involves capping outlier values to a predetermined threshold rather than entirely excluding them. For example, values beyond a certain number of standard deviations from the mean could be set to the threshold value of the nearest quartile. This approach avoids some of the distortion that full removal causes while still limiting outliers' impact on determinations of central tendency. It preserves some signal from outliers by keeping their general direction rather than completely discarding their values. Winsorization is well suited for cases where outliers may contain valid signals that complete removal would eliminate, but their exact observed values are still somewhat suspect due to potential measurement or recording errors. -
Further Exploration
When outliers cannot be conclusively identified as true errors based on the initial detection, a recommended next step is to conduct additional investigation into their potential root causes before determining how to treat them. This deeper exploration aims to establish whether outliers represent atypical yet valid observations versus mistakes that should be adjusted or excluded. Techniques like case reviews of individual outliers, checking for data entry or sensor malfunctions, and subject matter expert input can provide useful context. Based on what is discovered, an informed decision can then be made on whether to retain outliers as legitimate signals, winsorize them, or fully remove them from consideration depending on how well their origin can be understood and rationalized. This approach helps avoid losing potentially meaningful information while still controlling for known invalid values. -
Note Outliers without Modifying Data
Rather than immediately changing raw data values, another option is to simply document the detection of outliers through flagging or annotation without outright removing or adjusting them. This allows flexibility in how outliers are subsequently handled during analytical workflows. Outliers could be selectively included or excluded from different model training or statistical assessment scenarios to observe variances. It also maintains a record of anomalies for potential future reference while leaving the source information untouched. This “flag and track” technique supports robust decision-making by enabling exploration of outcomes from multiple perspectives including and excluding potential irregularities. -
Compare Results with and without Outliers
To gain a deeper understanding of outliers’ influence requires analysis of not just a single adjusted dataset, but direct comparison of results derived from the original full data alongside versions with anomalies addressed in different ways such as removal or winsorization. Seeing how key indicators, statistical significance, or predictive model performance changes according to inclusion/exclusion of outliers aids in verification of conclusions and flagging of cases warranting a more diligent examination. It informs judgment of outliers’ true impact versus being potential “noise”, supporting more nuanced evaluation over simplistic inclusion or exclusion alone.
The right approach considers the context and business goals. Properly cataloging adjustments avoids losing potentially useful information and ensures transparency.
Improving Data Insights through Outlier Management
Analyzing data after rigorously identifying and addressing outliers strengthens conclusions in several ways:
- It produces more accurate descriptive statistics by mitigating distortions from anomalous values.
- Data modeling incorporating outliers as valid extreme points leads to more realistic predictions.
- Identifying error sources through outlier root causes aids data cleaning to enhance future analysis.
- Preserving potentially informative outliers through detailed documentation supports deeper discovery of rare trends.
- Sensitivity analysis considering scenarios with and without outliers builds confidence in findings.
- Handling outliers systematically fosters replicability and transparency in the analytics process.
- It supports more robust decision making founded on sound analysis not misled by outliers.
Overall, proactively detecting and thoughtfully addressing outliers helps extract clean, reliable insights from data not obscured by anomalies. This improves the usefulness of data-driven decisions across various domains.
Conclusion
As emphasis on data and analytics grows, maintaining the validity of data infrastructure and analysis quality assumes paramount importance. Outliers present in data can seriously undermine insights if left unaddressed.
This blog post discussed outliers, why detecting them matters and techniques to identify anomalies. It also explained strategies to properly handle outliers to strengthen conclusions from data.
Outlier management establishes a strong basis for leveraging analytics to power informed decisions and desirable outcomes. With robust processes to address outliers, organizations can maximize the value of data-driven transformation initiatives.


