


Data is the fuel that powers nearly every business decision today. But making sense of endless rows and columns of raw data is no easy feat. This is where data visualization comes in - the graphical representation of information that enables faster and clearer analysis. However, creating actionable and insightful visualizations still requires significant manual effort. This is changing fast with recent advancements in artificial intelligence (AI).
AI has emerged as a game-changer for data visualization, elevating it from static graphs and charts to smart, interactive dashboards that update in real-time. With AI, anyone can now intuitively visualize data, find patterns, and generate strategic business insights without coding skills. Read on to understand how AI in data visualization is getting smarter and more useful.
The Role of AI in Data Visualization
At its core, AI allows computers to perform tasks that typically require human intelligence - speech recognition, visual perception, decision-making, language translation and more. In the context of data visualization, AI is transforming three key aspects:
Data Processing
AI has brought automation to the crucial but tedious task of data processing. This includes data collection, cleaning, transformation and analysis. Manual data processing can be extremely time-consuming and prone to human errors or biases. AI systems powered by machine learning algorithms can quickly process massive, complex datasets with greater accuracy and objectivity.
Specifically, AI handles three key aspects of data processing:
- Data Integration: AI can pull data from disparate sources like databases, APIs, cloud platforms, spreadsheets etc. and seamlessly integrate them for analysis. This saves significant manual effort in aggregating data.
- Data Cleaning: Real-world data tends to be incomplete, duplicate, inconsistent or containing anomalies. AI identifies and fixes such issues through techniques like outlier detection, handling missing values and resolving inconsistencies. This refinement and enrichment of data quality is crucial for downstream analytics.
- Feature Extraction: AI analyzes raw datasets to automatically extract meaningful patterns, trends and relationships between variables that can lend useful insights. This ability to identify signals within complex data enables impactful visualization and analytics.
By handling the heavy-lifting of data processing, AI systems free up human analysts to focus on high-value interpretative tasks. Business can tap deeper insights faster for accelerated decision making.
Visualization Creation
The broad goal of data visualization is to transform abstract information into intuitive graphical formats. But choosing optimal visualization types manually can be challenging even for experienced analysts. AI automation comes to the rescue here as well.
Based on a deep understanding of the processed data, AI visualization tools can automatically recommend the most appropriate charts. Key capabilities here include:
- Metadata Analysis: AI analyzes dataset metadata - data types, size, ranges, distributions etc. - to detect inherent relationships between variables. This informs suitable visualization formats.
- Pattern Recognition: Algorithms identify hidden correlations, clusters, trends, seasonality within data. These patterns dictate optimal graph types that can clearly convey the embedded insights.
- Constraint-based Modeling: Factors like audience, use case and platform constraints are modeled programmatically to pick visuals tailored to end-user needs for maximum impact.
Equipped with these techniques, AI systems can match datasets to appropriate graphs like bars, pies, lines, scatter plots etc. tailored to characteristics and patterns within data. This augments and enhances manual visualization creation by analysts.
Insight Generation
The ultimate yardstick for visualization success is actionable insights that drive real outcomes. AI lends unmatched power here by not just identifying insights but even predicting future trends from data. Continuous feedback loops enable the models to keep learning and improving their analytical prowess over time.
Key AI capabilities for insight generation include:
- Discovering Insights Multi-dimensional data mining uncovers vital findings like key influencers of outcomes, customer behavior patterns, operational bottlenecks etc. that can inform business strategy.
- Predictive Analytics Based on historical data, AI forecasts outcomes like sales, demand, inventories, prices etc. with a reliable degree of accuracy. This powers data-driven planning.
- Prescriptive Guidance AI moves beyond passive insights to actively recommend optimal actions like which products to launch, channels to invest in, campaigns to double down etc. to capitalize on opportunities.
This transformation of static reporting into an intelligent, forward-looking advisor is the holy grail for modern analytics. AI empowers data visualization tools with this ultimate capability for data-driven decision making with tremendous business impact.
With these AI functionalities now accessible through no-code analytics platforms, anyone can harness them without prior technical skills.
AI Data Visualization Technologies
The rapid leaps in AI data visualization are enabled by a few key technological innovations:
Natural Language Processing (NLP)
This branch of AI focuses on interactions between computers and human language. NLP powers various user-friendly interfaces for data visualizations including conversational chatbots, voice commands, and search queries where users can ask questions in plain language instead of complex database queries to get answers in visualized formats.
Automated Machine Learning (AutoML)
This AI capability automates parts of the traditional machine learning workflow like data processing, model building, hyperparameter tuning and more. In data visualization, AutoML enables non-technical users to process data and generate interactive dashboards automatically just by connecting data sources like online apps or databases.
Generative AI
This emerging AI technique focuses on generating new artifacts like text, images, video or data from scratch. In data visualization, generative AI can create entirely new visualizations or dashboards that are customized and optimized for specific audiences and use cases. This provides bespoke interactive environments for enhanced data understanding.
AI in Data Visualization: Real-World Use Cases
Here are the ways AI enhances data analytics through intelligent visualization in key industries:
Marketing Analytics
For digital marketing teams, AI enables pulling insights from multiple disjointed sources like website analytics, ad data, social media conversations into one unified view. AI processes this vast data, detects crucial patterns, determines optimal visualizations, and creates interactive dashboards highlighting key trends and metrics. These could provide actionable inputs to optimize campaigns and messaging for higher ROI.
Supply Chain Analytics
In supply chain operations, AI can combine and analyze complex shipment data to generate dashboards with visual metrics on delays, wastage, returns, and more. The continuous updates from incoming data enable real-time monitoring of operational KPIs. This allows teams to instantly identify problem areas, respond faster and streamline processes through data-driven decisions.
Financial Data Analytics
In banking, insurance or financial research, analysts need to monitor various financial indicators to uncover market patterns and unique investment insights. An AI system can process billions of data points across news, regulations, financial statements, economic trends and other unstructured data. It can then visually highlight correlations, bubbles, early warning signals to help analysts mitigate risk and capitalize on investment opportunities.
AI-Powered Data Visualization: How to Get Started
Here are the typical steps to leverage AI effectively for data visualizations:
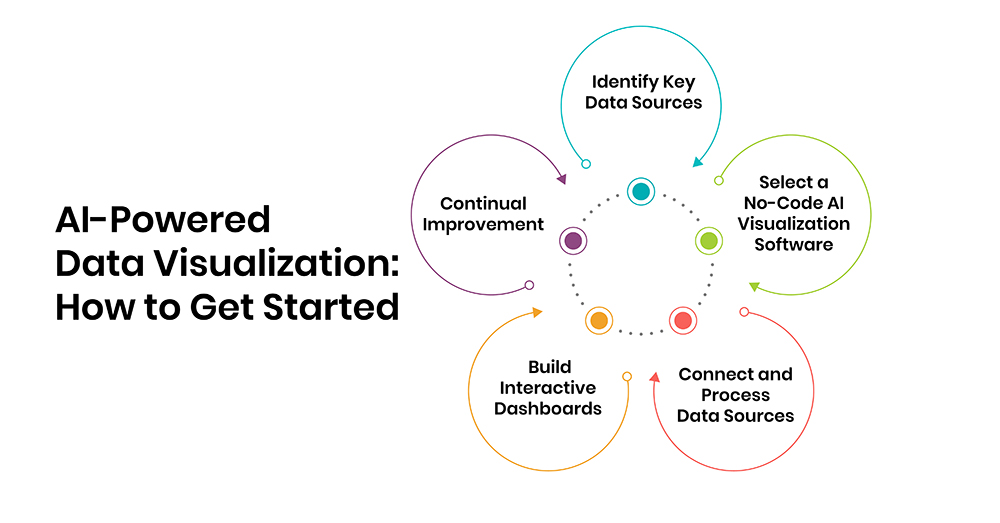
1. Identify Key Data Sources
The first step is to strategically identify the key data sources that are most relevant to your business goals. These could include:
- Transactional data: Point-of-sale systems, ecommerce platforms, inventory databases etc.
- Customer data: CRM systems, marketing automation platforms, customer support records etc.
- Operational data: Manufacturing logs, supply chain systems, HR records etc.
- External data: Economic indicators, social media metrics, competitive intelligence etc.
Prioritize high-value datasets that offer the greatest potential to drive insights and decision making. Stay aligned with overall business objectives.
2. Select a No-Code AI Visualization Software
Next, choose a no-code AI data visualization software that makes it easy to work with data without coding skills. Top AI tools for data visualization include:
- Tableau - Offers automated insights, forecasting capabilities and an easy-to-use visualization interface. Integrates AI through partnerships with tech giants like AWS.
- Microsoft Power BI - Its built-in AI visualizations provide predictions, sentiment analysis and anomaly detection. Seamlessly leverages Azure AI capabilities.
- OmniSci - Specialized in processing massive datasets with high concurrency. Its GPU-powered analytics and visualization are ideal for real-time applications.
Evaluate capabilities around automating data preparation, analysis and reporting. Select a flexible platform suitable for your skill level and use case.
3. Connect and Process Data Sources
Now it's time to connect to your high-priority datasets. The visualization software should allow you to connect to databases, cloud storage, spreadsheets and more.
Leverage the AI automation capabilities to process the raw data at scale. Machine learning algorithms can clean, transform and enrich datasets, preparing them for analysis.
Depending on the tool, processing large datasets may require provisioning cloud infrastructure with sufficient computer power.
4. Build Interactive Dashboards
With clean, unified datasets, you can start interactively building custom dashboards and apps powered by AI-generated visual analytics.
Drag-and-drop interfaces make it easy to create rich visualizations like charts, graphs and heat maps. The AI capabilities will recommend best-fit visualizations.
Explore the data from different angles with filtering, segmentation and drill-down capabilities. Spot patterns, trends and outliers through automated insights.
5. Continual Improvement
Keep fine-tuning and enhancing visualizations using immersive interfaces with conversational AI, natural language queries and visual data exploration.
Leverage query modules and virtual assistants to ask questions about your data in plain English and further refine analysis.
Enable continual learning within AI models to keep gaining more contextual insights over time as new data comes in.
Using the above strategies, even first-time users can start benefiting from AI for spotting hidden insights through data visualization right away without prior technical skills.
Overcoming Challenges in Adopting AI for Data Visualization
Despite the immense potential, adopting AI-powered tools does come with a few limitations today:
- Poor Explainability: Most AI models function like black boxes without explaining the underlying logic behind the visualizations. Users need more clarity on how conclusions are reached. Vendors need to improve solution transparency.
- Risk of Automation Bias: There is some over-reliance on trusting automated systems without the ability to critically analyze the presented visual information. However, AI systems are designed to augment and not replace human judgment. The goal should be to combine automated power with human domain expertise and oversight.
- Bias and Inaccurate Predictions: Since AI algorithms are trained on historical datasets, any inherent biases like gender or racial discrimination in the data will get amplified through biased visuals leading to unfair predictions. Continued algorithmic enhancements to mitigate bias are essential for responsible AI.
- Scaling Complexity: While no-code tools are democratizing analytics today, scaling capabilities to handle more complex large-scale visualizations still requires skilled AI expertise. Improved computational power and more intuitive user interfaces will help tackle complexity.
The Future of AI in Data Visualization
As AI research progresses, data visualization capabilities will grow exponentially. Glimpses into potential futures unfolded by AI include:
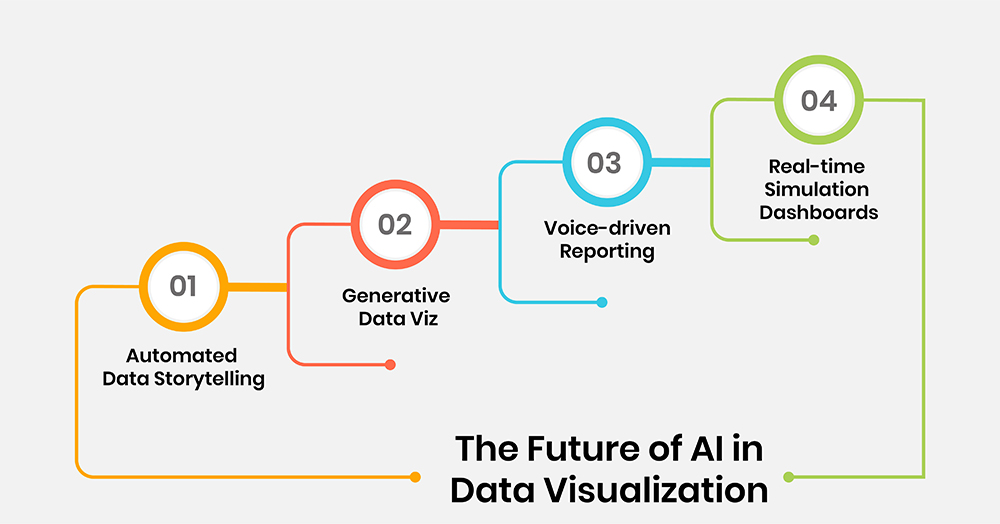
- Automated Data Storytelling: Similar to automated article generation in natural language processing today, AI could soon automatically analyze data and generate complete interactive dashboards with detailed analysis explaining key statistical insights, trends and predictions in easy-to-understand narratives customized to reader preferences.
- Generative Data Viz: Generative AI and deep learning will be combined to build customized data visualization solutions optimized for specific business needs, usage patterns and user segments to power next-generation business intelligence.
- Voice-driven Reporting: Natural language interfaces through voice recognition will drive immersive exploration of visualizations using conversations with data through speech, enabling hands-free dynamic interactions with data.
- Real-time Simulation Dashboards: As capabilities for simulating future scenarios advance, AI-driven dashboards will integrate real-time simulation models to visualize future projections and evaluate what-if hypotheticals through easily adjustable parameters.
Conclusion
While AI integration is already streamlining how enterprises of every size make critical business decisions through data, there remains tremendous untapped potential emerging through ongoing AI research innovations. Adopting AI-powered visual analytics is no longer an option but an urgent imperative for forward-thinking decision-makers across industries to outpace disruption now and in the future guided by automated, real-time intelligence.


