
The COVID-19 virus has impacted us both in the real and the virtual world. As the cases surge across the globe, a flood of COVID-19 statistics and information is sweeping us all across fronts in print and online media. Pinning genuine and reliable information has become a task. These basic calculation methods will help you understand the pandemic better. It will also help you identify reliable information from bad, noisy and cluttered data on the internet.
Though we have used them in the context of the current pandemic, their applications are versatile and wider in range.
Case fatality rateThis is the data that you see on news channels and CDC briefings. At present, the relationship between the COVID-19 fatalities and death rate is assumed to be linear.
CFR is calculated as:

In statistics, two kinds of hypotheses are used to get insights from the data.
- Null hypothesis meaning there is no relationship between the variables.
- Alternative hypothesis meaning a significant relationship exists between the variables.
P-value gives the probability of your result being significant. It ranges between 0 and 1. The lower the number, the stronger is the association between the variables.
A March 2020 study by Fei Zhou et. al says the COVID-19 outbreak has a p-value of .0008. Which means a probability of .08 percent of the results being random. In other words, 99.92 percent chances of the findings being correct.
Alpha Levels or Significance levelsAlpha is the probability of your hypothesis being wrong. When you have an alpha level of 3 percent, there is a 3 percent chance of your assumption being wrong.
Often novices confuse between P-values and alpha. While alpha is used to refer to the pre-study assumption, P-value is calculated.
Ro or Basic Reproductive numberThe transmission potential of disease, Ro, measures the number of people infected by one person. It excludes the cases generated by secondary infections. If the Ro is greater than one, the disease is declared an epidemic.
The Ro for COVID-19 is estimated to be 2.2 meaning a COVID-19 infected person is likely to spread the virus to 2.2 people. Ro for measles is 15.
Environmental, biological, and other factors influence Ro. When these are applied to complex modeling processes, they can lead to “easily misrepresented, misinterpreted, and misapplied" (Delameter, et. al, 2019)” conclusions. Unless you are an epidemiologist, considering an approximate number will be a more pragmatic strategy.
Inter Quartile Range (IQR)To calculate IQR, data is arranged to get a median; divided into quartiles or four equal parts, and; trimmed on both ends (the top and bottom quarter from the median list). IQR helps in identifying outliers in the sample dataset. These can be anomalies, experimental errors, or variability in measurement. For example, a person’s age can be wrongly entered as 300 years in place of 30. Outliers must be removed from the dataset.
IQR for COVIS-19 is around 41-58 years with a median of 49.0 years. This means most cases lie in this range.
Confidence Interval and Confidence Level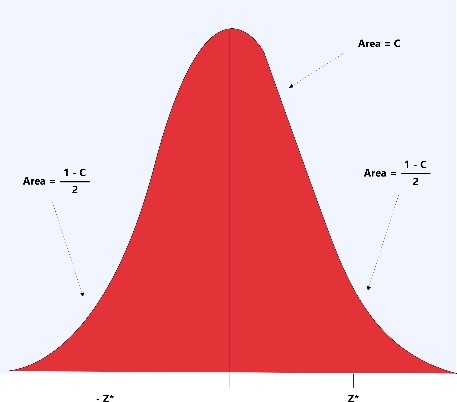
“A confidence interval gives an estimated range of values which is likely to include an unknown population parameter, the estimated range being calculated from a given set of sample data.” - Valerie J. Easton and John H. McColl's Statistics Glossary v1.1)
0.90, 0.95, and 0.99 are commonly chosen as confidence intervals. A confidence interval of 0.95 covers 95 percent area of the normal curve and only 5 percent of cases are expected to deviate that are disturbed equally at the tail of the curve.
The confidence level is the amount of certainty you have about the results. Dr. Richard Ellison's study Transmission of the Novel Coronavirus: Early Findings says the confidence level of COVID-19 Ro is 95 percent.
The COVID-19 incubation period (5.2 days) has a confidence level of 95 percent.
Mann-Whitney and Chi-Squared TestsThese are used to identify the type of variables. The most common types of variables used are continuous variables and categorical variables. Continuous variables, as the name suggests, is a list of variables that continues endlessly (Example: number of days from today till eternity). Categorical variables can be divided into categories (Example: throat cancers, heart diseases).
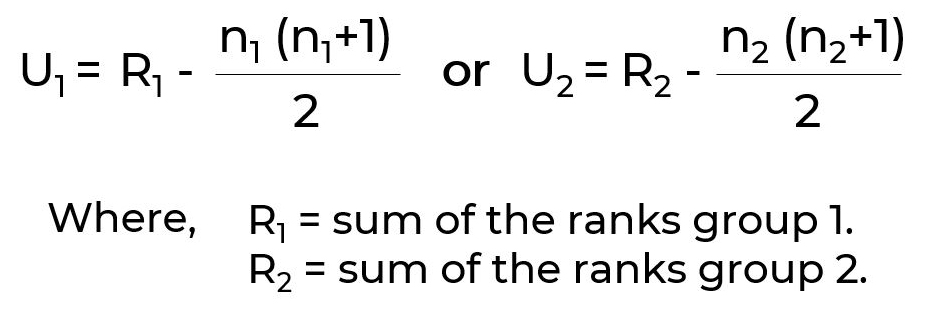
The Mann-Whitney U test is used when the dependent variable is continuous, but not normally distributed. For example, to understand salary based on education level. The formula for Mann-Whitney U test is:
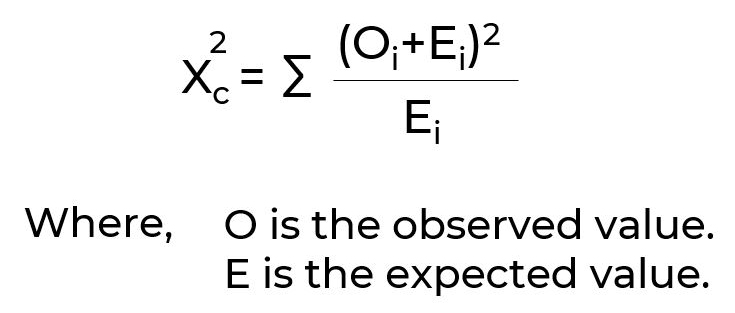
Chi-Squared Tests are used to calculate categorical variables to see if the sample data matches a population or to see if two variables in a contingency table are related. The formula for Chi-square test is:
Both Chi-Square and Mann-Whitney U test can give p values.
As we dig down deeper into the COVID-19 crisis, many advanced models and calculation methods are helping us get a concise picture. Follow this space for more insights.


