


In the field of data science, statistical tests are crucial for drawing conclusions and checking the correctness of the models. These tests are beneficial for data scientists who want to analyze the data and make proper conclusions from the data analysis. Therefore, it is essential to be familiar with the various statistical tests in data science to produce valid and reliable results. This article presents five fundamental statistical tests that every data scientist should learn to complement their knowledge and become more effective in their work.
Types of Statistical Tests in Data Science: An Overview
It is paramount to choose the correct statistical test to help draw the right conclusions from the data. Statistical tests can be broadly categorized into two types: parametric and non-parametric.
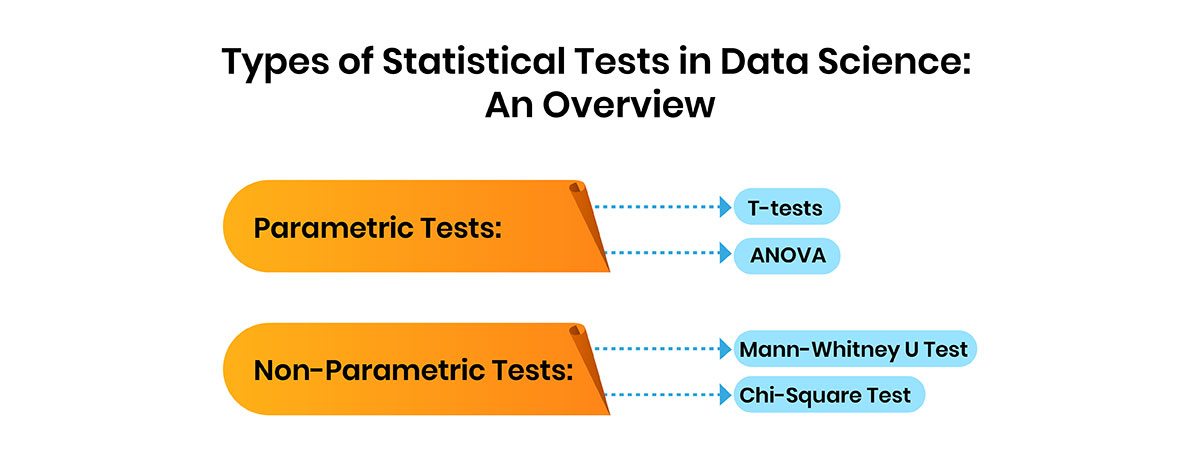
- Parametric Tests: These tests are based on the assumption that data is usually distributed. Some of them are T-tests and ANOVA. They are practical, though the data is expected to fulfil certain assumptions, such as homogeneity of variance.
- Non-Parametric Tests: These tests do not make any assumptions about the distribution of the data. Examples of these are the Mann-Whitney U Test and the Chi-Square Test. They are more flexible and can be employed when data encounters a scenario that does not fulfil the assumptions for parametric tests.
Knowing these kinds of statistical tests assists the data scientists in selecting the correct technique for analyzing data to get proper outcomes.
T-Test: A Fundamental Tool for Data Scientists
The T-test is one of the most fundamental statistical tests widely used by data scientists. It checks for the equality of means between two populations, which is helpful in hypothesis testing and other experiments. By comparing the means, the T-test allows data scientists to determine whether the differences are due to chance or are more significant.
Critical Types of T-Tests:
- One-Sample T-Test: This test compares the mean of a single sample with a specific or theoretically predicted value. It is helpful to determine whether the sample mean differs significantly from one particular value, such as the population mean.
- Independent-Sample T-Test: This can also be known as a two-sample T-test and is used to compare the mean of two different samples to see if they are, in fact, different. For instance, data scientists could employ it to assess the performance of two marketing techniques.
- Paired-Sample T-Test: This parametric test compares the mean of two related samples. It is frequently applied to prove cause-effect relationships when the same subjects are examined under two-time conditions.
Statistical Equation:
The T-Test is based on the following formula:
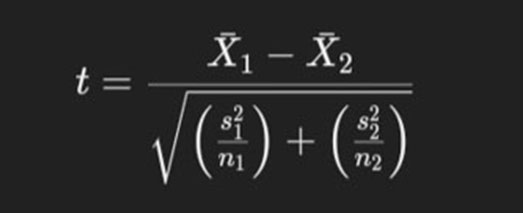
Where:
- X1 and X2 are the sample means.
- s21 and s22 are the sample variances.
- n1 and n2 are the sample sizes.
Application in Data Science:
- A/B Testing: It is a very important test in data science when comparing two parameters or variables, for instance, when testing A/B in a webpage, email, or product feature. The Independent-Sample T-test is used to compare the performance metrics and is noted if the difference is statistically meaningful.
- Quality Control: In manufacturing and process control, data scientists apply the one-sample T-test to determine if the mean of a product characteristic, such as weight or size, differs from the target value.
Data scientists must understand that the T-test is to make correct decisions based on data and be confident that the results are statistically significant.
Chi-Square Test: A Crucial Tool for Categorical Data Analysis
The Chi-Square Test is a vital statistical test performed by any data analyst to analyze two nominal variables and see whether or not they are related. It is most useful when the data is split into areas such as gender, product type, or favorite services. This test is crucial for making decisions when conducting relations analysis in categorical data.
Types of Chi-Square Tests:
- Chi-Square Goodness-of-Fit Test: This test checks whether the sample data belongs to a particular population with a given distribution. For example, it can be used to determine whether the results in a given trial are random by comparing the observed values of each constructor with the theoretical values.
- Chi-Square Test of Independence: It tests the hypothesis that two categorical variables are related. For example, a data scientist can apply this test to determine whether there is any correlation between customer satisfaction and gender.
Statistical Equation:
The Chi-Square statistic is calculated using the formula:
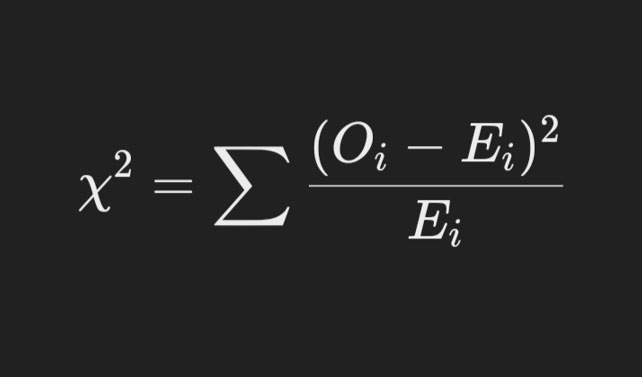
Where:
- Oi is the observed frequency of the ith category.
- Ei is the expected frequency of the ith category under the null hypothesis.
Key Considerations:
- Assumptions: The Chi-Square Test also assumes that the variable under consideration is categorical while the observations are independent. It even demands that the expected frequency in the respective categories should be five.
- Limitations: Spearman correlation coefficient statistics only tell whether a positive or negative relationship exists between two data sets.
Real-World Application:
- An example of the Chi-Square Test in data science approaches is examining survey results to evaluate whether customers' preferences for a particular product depend on age. Based on the results of the Chi-Square Test, a data scientist can decide which features are significant, for example, adjust the advertising messages according to the ages of the targeted people.
The Chi-Square Test is an important test that enables data scientists to make essential conclusions regarding categorical variables, enhancing the overall business solutions and results derived from the analysis.
Comprehensive Analysis of Variance (ANOVA)
Analysis of variance, or ANOVA, is one of the most valuable statistical techniques for comparing the mean of three or more groups to test the null hypothesis that at least one group's means differ. This test is crucial in statistics whenever the relationship between the variables is to be investigated to ascertain the effect of one variable on another.
Types of ANOVA:
- One-Way ANOVA: Explores the significance of at least three unrelated groups about one independent variable.
- Two-Way ANOVA: Analyze how two independent variables influence the dependent variable and determine if the two independent variables interact.
- MANOVA (Multivariate Analysis of Variance): A more advanced type of ANOVA that allows for testing of multiple dependent variables at the same time.
ANOVA Equation:
F= Mean Square Between (MSB) / Mean Square Within (MSW)
Where:
- MSB = Sum of Squares Between (SSB) / Degrees of Freedom Between (dfB)
- MSW = Sum of Squares Within (SSW) / Degrees of Freedom Within (dfW)
Application in Data Science:
- ANOVA is often employed in experimental layout, model selection, and model comparison, where it is used to determine which model has the best performance. Its primary function is to quantify the impact of the various factors.
- For example, a data scientist may use One-Way ANOVA to establish the effectiveness of different machine learning models trained on various data sets by determining which sets produce the best model.
For data scientists, learning and applying ANOVA allows them to make a decision based on statistics while allowing for valid and reliable analytical findings.
Regression Analysis: A Cornerstone of Predictive Modeling
Regression analysis is one of the core statistical techniques commonly employed by data scientists to model the association between different variables and make forecasts. It has a significant role in data analysis, especially in predictive analysis, in which the purpose is to uncover and assess the impact of one or many predictor variables on a criterion variable.
Critical Aspects of Regression Analysis:
- Linear Regression: The linear regression of the most straightforward type is used to establish the connection between the dependent variable and a single predictor variable. It supposes a total relationship and is suitable for use where the outcome variable is the continuous type.
- Logistic Regression: This type of regression is used when the dependent variable is binary or categorical, but the independent variable is continuous. It gives an expectation of a specific event, such as whether the customer will likely churn.
- Multivariate Regression: It involves a case where each variable depends on and operates independently, but its relationship is with other variables. This regression is ideal in complex models with multiple input or predictor variables, like housing price determination through location, size, and facility.
Statistical Equation:
The equation for simple linear regression, the most basic form, is:
Y = β0 + β1X + ϵ
Where:
- 𝑌 is the dependent variable.
- β0 is the intercept (the value Y when X=0).
- β1 is the slope (change in Y for a one-unit change in X).
- X is the independent variable.
- ϵ is the error term, representing the difference between the observed and predicted values.
Application in Data Science:
- Predictive Analytics: Regression models aid data scientists in making future predictions, incorporating elements like sales expectations in a given period or customer behavior.
- Feature Selection: It is also employed to identify the variables that significantly affect the result to help select variables for Machine Learning Models.
- Model Evaluation: In the regression analysis, statistical measures such as R-squared and p-values are used to determine the model's accuracy and relevance.
Knowledge of regression analysis enables data scientists to develop effective and efficient models that can provide insights and support decision-making.
Mann-Whitney U Test: An Essential Non-Parametric Tool for Data Scientists
The Mann-Whitney U Test is one of the commonly used non-parametric tests, implemented when the assumptions of the T-Test cannot be met, especially when the data is not normally distributed. This test determines the differences between two independent groups on a single dependent variable, which can be continuous or ordinal. It is used in circumstances involving small samples or skewed data and can be a valuable asset for data scientists.
Key Points about the Mann-Whitney U Test:
- Purpose: The Mann-Whitney U Test compares two independent groups and determines whether there is a significant difference in their distributions. It is also a helpful test since it does not require the data to be normally distributed, as in parametric tests.
- Application: This test is especially beneficial in ordinal or continuous data that doesn't follow the normal distribution. It can be used to compare two distinct treatment groups, such as assessing the success of two marketing campaigns through customer satisfaction scores.
- How It Works: The test sorts all the values from both groups together. It then contrasts the sum of ranks between the two groups to determine whether one group has a higher or lower rank than the other.
- Example: When comparing two different drugs in a clinical trial, if the data regarding patient responses is skewed or non-parametric, the Mann-Whitney U Test can be used to check for a significant difference in the efficacy of the two drugs.
Statistical Equation:
The Mann-Whitney U statistic is calculated as follows:
U = n1×n2 + n1×(n1 + 1) / 2 - R1
Where:
- n1 and n2 are the sample sizes for the two groups.
- R1 is the sum of the ranks for the first group.
Data scientists need to know and use the Mann-Whitney U Test to compare two data groups when other conventional tests, such as the t-test, are not suitable.
Conclusion
Learning these fundamental statistical tests in data science is essential for any data scientist to get valuable insights and prove the models' validity. Every test has advantages for specific data and research questions, ranging from comparing averages to evaluating associations. Performance on these tests raises the capacity for planning and decision-making based on the data and promotes sound and effective analytical techniques. Utilizing these statistical tests in data science will significantly enhance the credibility of your findings and analyses.