The ability of Data analysis to provide relevant information to diverse firms is achieved in contemporary businesses. Thus, with the huge quantities of information generated in recent times, Data analysis tools have become even more critical. They simplify processes of sorting through complicated information and make it easier for the professional to process information and research data for meaningful conclusions from large sets. There is an effective guide on the best services for data analysis with key features, the purpose of the application, and selection criteria based on the type of data analysis.
Criteria for Choosing Data Analysis Tools
Selecting the right data analysis tools involves considering several critical factors:
- Type of Data and Complexity: Some of the critical factors that influence when choosing the right tool are derived from the nature of the collected data which may be structured, unstructured, or big. Software such as Apache Hadoop best serves large data sets, but Excel is reasonable for modest tasks.
- Types of Data Analysis Required: Another advantage is that there are unique tools for specific data analysis. For example, Python and R are suitable for exploratory data analysis and machine learning in contrast with Tableau which has been deemed favorable for producing interactive reports.
- User Expertise and Technical Skills: Assess the overall technological expertise of the team. Microsoft Excel and tablet apps are mostly preferred because they are easy to use, while Python and R are based on some knowledge of computer programming.
- Integration with Existing Systems: Check that the tool fits in with the existing infrastructure and other software in place.
- Scalability and Performance: Determine if the tool can meet your current and future data volumes and learn if it has efficient performance when it is dealing with large amounts of data.
Top Data Analysis Tools and Their Use Cases
Choosing the right data analysis tools can significantly enhance the efficiency and accuracy of data-driven decision-making processes. Here’s a detailed list of some top tools and their best use cases:
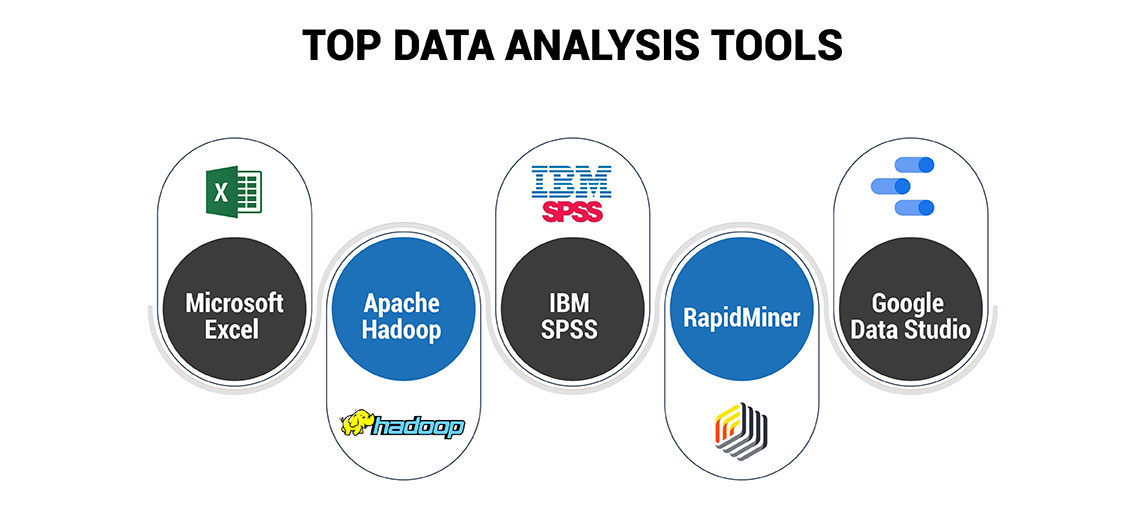
1. Microsoft Excel
Overview of features:
- Microsoft Excel is a very common spreadsheet with advanced calculating and graphical tools.
- It comprises tools like pivot tables, conditional formatting, and the like; as built-in formulas for statistical, financial, and logical calculations.
- Microsoft Excel allows importing content from other sources and using other Office programs.
Best suited for:
- An example of such simple analytics is sorting, filtering, and aggregation of data.
- Fast data analysis and data visualization with the help of charts and graphs.
- Distributed data that is of small to medium size and is going to be accessed by several users without delays and with little focus on the usability of the system.
- Working with prototyped assignments for more difficult data analysis before progressing to sophisticated software.
Advantages and limitations:
- Advantages: Possesses a user-friendly GUI, is well-documented, and is available with a large number of users. It also supports a wide range of add-ins, and it allows the user to have complete control through VBA.
- Limitations: Inability to deal with large dataset size, shortcomings in advanced statistics and machine learning, and using excessive memory in handling very large models.
2. Apache Hadoop
Overview of features:
- Apache Hadoop is an open-source Big Data platform, which is responsible for distributed storage and processing using the MapReduce programming model.
- It consists of four main modules: Hadoop Common, Hadoop Distributed File System (HDFS), Hadoop YARN, and Hadoop MapReduce.
- Hadoop also has tools like Apache Hive, Apache Pig, and Apache Hbase which makes it a bit more powerful in processing and analyzing the data.
Best suited for:
- Processing and storing massive amounts of structured and unstructured data across distributed machines.
- They distributed environments where work is partitioned directly into sub-tasks to work in parallel.
- Analytical intelligence in industries such as banking, medical services, and retail.
Advantages and limitations:
- Advantages: Scalability to manage data increases, cost-effectiveness in data storage, fault tolerance of data over the network, and flexibility in data storage management.
- Limitations: To install and maintain the solution the organization needs highly qualified engineers who can manage it. It also has higher latency for some types compared to competitors’ offerings and includes somewhat complicated debugging and troubleshooting procedures.
3. IBM SPSS
Overview of features:
- SPSS (Statistical Package for the Social Sciences) is an advanced analytical software solution for statistical analysis in business. It has added statistical analysis, data editing, and documentation capabilities.
Best suited for:
- Statistical analysis in social sciences: SPSS is one of the most preferred statistical analytic software in academia for social science research because of the large number of statistical tests required in such studies and the software’s user-friendliness.
- Handling complex survey data: SPSS is suitable for processing and analyzing survey data, which is a major component of work in market research, health research, and education research fields.
- Predictive data analysis: As a statistical data analysis tool, SPSS can use past data to identify trends and predict future occurrences.
Advantages and limitations:
- Advantages: Friendly for its GUI, offers statistical function highly, robust on big datasets, and good on survey data analysis.
- Limitations: Expensive for professional editions, complicated user interface for more advanced tools, and weak connectivity with other trendy data science platforms by comparison to open-source platforms like Python and R.
4. RapidMiner
Overview of features:
- RapidMiner is an easy-to-use yet versatile tool that offers much to the field of data analysis and machine learning. It creates an easy design workflow for users with both technical and technical expertise. RapidMiner accepts several data formats and is easily incorporated with other tools and databases, thus increasing its flexibility.
Best Suited For:
- Data mining and machine learning: In terms of algorithms available for both data analysis and model building, rapid mining is sufficient for advanced data analysis.
- End-to-end data science workflows: RapidMiner is a process of data science with a solution for each step of the analyst process.
- Predictive data analysis: RapidMiner is considered powerful for modeling historical data to predict outcomes.
Advantages and Limitations:
- Advantages: RapidMiner has an interesting graphical interface that enables the user to create complex data analysis workflows without using programming.
- Limitations: RapidMiner is simple to use but there are some of the features that will take the not-so-technically inclined user a while to figure out.
5. Google Data Studio
Overview of features:
- Google Data Studio is a business intelligence application that provides free report and dashboard creation and sharing.
- It is possible to connect GA to various Google services like Google Analytics, Google Ads, Google Sheets, and other sources of data.
- The customers can independently develop graphs, use templates, and use drag and drop to simplify the operations.
Best suited for:
- Strategy for the development of visually appealing and interactive reports and dashboards.
- Working with and displaying data from different sources specifically those from the Google world.
- Using descriptive statistics procedures to analyze data for trends and patterns.
Advantages and limitations:
- Advantages: Easy to use, complete with live sharing, not available at a cost, and highly supported on Google applications.
- Limitations: Compared to more specialized tools, reduced scope of advanced analytics capabilities, need for Internet connectivity, and reliance on the Cloud for data storage.
Matching Tools to Use Cases
The choice of statistical analysis tools also depends on the nature of the analysis that needs to be carried out. Here are three key factors to consider
1. Type of Analysis Required:
- For descriptive analysis: Microsoft Excel and Google Data Studio are perfect with their user-friendliness and visualization power.
- For predictive analysis: Python and R are perfect examples of scientific languages due to their strong focus on advanced statistical and machine learning opportunities.
- For prescriptive analysis: The best software solutions to process massive data and model complicated data are SAS and Apache Hadoop.
2. Data Volume and Complexity:
- Small to medium datasets: For these some basic analysis and visualization capabilities can easily be supported by Microsoft Excel and Tableau.
- Large datasets: The Apache Hadoop and SQL are meant to aid in handling immense volumes of data that a database can be expected to handle without compromising on the speed.
3. User Expertise:
- Beginners: The interface of Microsoft Excel and IBM SPSS is quite simple and has simple analysis functions.
- Advanced users: Python and R have rich libraries and possibilities for deep exploratory data analysis.
Conclusion
The right data analysis tools in data analytics are essential for collecting useful information and making decisions. All the above discussed tools are useful in their own right and have a specific range of applications – from simple manipulations in Microsoft Excel to calculating statistics in R and Python. The choice depends on your project’s specifics, the data complexity, the level of users’ skills, and the ability to integrate tools. The right balance of tools improves analytical skills, empowers organizations to develop and maintain effective techniques for decision-making, and helps to produce planned results that are easily actionable and reliable for any organization.


