Data visualization plays a pivotal role in today's data-driven world, transforming complex datasets into clear, compelling visuals that drive informed decision-making. Data interactives not only increase engagement but also reveal information. D3.js is a strong JavaScript tool to help developers create interactive, dynamic, scalable, and effective graphic designs and functional web-based visualizations. In this article, we will explore how to use D3.js to create engaging visuals that convey your data messages.
Setting Up Your Environment for D3.js Development
Before learning to create data visualizations with D3.js, you must have a solid, efficient development environment ready. Follow these steps to ensure a smooth setup:
- Install D3.js: You can download the latest version of D3.js from the official website or include it in your project if you use a content delivery network (CDN) link. If you want to add D3 to your web application quickly, you should use a CDN.
- Prepare Your Workspace: Create a separate folder for your project file, `index.html,` a `CSS` folder for styles, and a `JS` folder for scripts, etc.
- Configure Your Development Tools: An ideal code editor has syntax highlighting and debugging capabilities, facilitating simpler coding and error detection routines. Set up live server functionality so your code will update live for you in real time.
- Include Necessary Resources: Before you do anything, ensure your HTML file is linked to the D3.js library and has other necessary resources, such as external stylesheets.
This setup allows for creating interactive data visualizations while maintaining your workflow as efficiently and organized as possible.
Core Concepts of D3.js: Selections and Data Binding
D3.js has one of the most powerful functions, allowing data bindings to DOM elements and allowing you to do dynamic manipulations over them. Selections and data binding comprise this capability's core to create efficient data visualizations.
Key Concepts:
-
Selections:
In D3.js, DOM elements are targeted and manipulated declaratively. Developers also use methods such as .select() and .selectAll() to select the elements bound with data and then transform.
Code Snippet:d3.select("body").append("p").text("Hello, D3.js!");
-
Data Binding:
It allows us to link a dataset to selective DOM elements through the .data() method, enabling a smooth synchronization of the two visual representations.
Code Snippet:const data = [10, 20, 30];
d3.select("svg")
.selectAll("circle")
.data(data)
.enter()
.append("circle")
.attr("r", d => d); -
Enter, Update, Exit Pattern:
This model dynamically manages how data joins with elements:
- .enter(): Creates new elements for incoming data.
- .update(): Adjusts existing elements to reflect updated data.
- .exit(): Removes elements no longer needed.
Crafting Foundational Visuals: Your First Chart with D3.js
D3.js effectively helps you to create a foundational chart and gradually expand or change it, thereby introducing to dynamic and interactive data visualization elements. Learning the structure of basic elements like scales, axes, and SVGs will prepare you for more complex visualization.
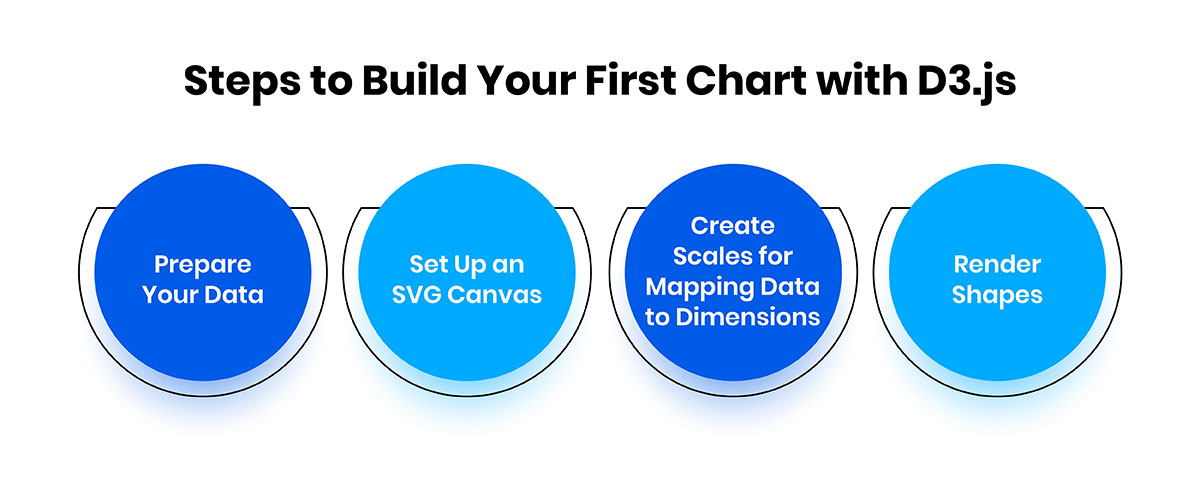
Steps to Build Your First Chart:
-
1. Prepare Your Data
An array of objects, each object contains key-value pairs relevant to the visualization.
Code Snippet:const data = [ { value: 10 }, { value: 20 }, { value: 15 } ];
-
2. Set Up an SVG Canvas
Use an SVG element to define the dimensions of your visualization — the container for all graphical components.
Code Snippet:const svg = d3.select("body")
.append("svg")
.attr("width", 500)
.attr("height", 300); -
3. Create Scales for Mapping Data to Dimensions
Map your data values to pixel coordinates with linear scales.
Code Snippet:const scale = d3.scaleLinear()
.domain([0, d3.max(data, d => d.value)])
.range([0, 300]); -
4. Render Shapes
Graphics are made using SVG rectangles, representing data points. Each bar data value represents a scale value, which is then correlated to the height or width of the bar.
Code Snippet:svg.selectAll("rect")
.data(data)
.enter()
.append("rect")
.attr("x", (d, i) => i * 40)
.attr("y", d => 300 - scale(d.value))
.attr("width", 30)
.attr("height", d => scale(d.value));
Enhancing Your Visualizations with Dynamic Animations
Tweaking an animation on your data visualizations increases user engagement and improves the overall storytelling of your data. Dynamic transitions made with D3.js enable smoother visual experiences and can lead users through data changes effectively.
- D3.js Transition Functions: D3.js has robust transition methods, like '.transition(),' which make elements playable and smooth over increasing time. This makes it very convenient to illustrate data changes and makes the transitions more pleasant and naturally visual.
- Animating Elements: An example is animating the bars in a bar chart from zero to their final value to focus on data progression. This .duration() allows you to control the speed of the animation, making it smooth without losing the visual cohesion.
- Data Transitions: D3.js is designed to let you add new points or remove outdated ones and seamlessly transition to a ‘new’ chart whilst maintaining the integrity of your chart’s layout. This is especially useful in such real-time visualizations where the data is continuously updated.
- Interactive Animations: Combine animations with events like hovering or clicking, and you can increase interactivity. For example, you can animate a detailed tooltip over the hover of a data point or even expand elements dynamically.
Making Visualizations Interactive: Adding Tooltips and Click Events
Interactivity is central to D3.js's ability to create engaging data visualizations. It allows users to discover and interact with data in meaningful ways. You can add tooltips, click events, and more to make your visualization dynamic.
Adding Tooltips for Enhanced Data Insight
Tooltip is used when input users hover over data points in the dataset to provide additional contextual information. To implement tooltips:
- Adding tooltips with D3 each requires the use of the mouseover and mouseout events.
- Add an HTML element (e.g., div) styled as a tooltip and position it using the mouse coordinates.
- The tooltip is bound to the special data points to display the relevant info.
Code Snippet:
svg.selectAll("circle")
.on("mouseover", function(event, d) {
d3.select("#tooltip")
.style("opacity", 1)
.html(`Value: ${d.value}`)
.style("left", `${event.pageX + 10}px`)
.style("top", `${event.pageY - 20}px`);
})
.on("mouseout", function() {
d3.select(
"#tooltip").style("opacity", 0);
});
Adding Click Events for Interactive Exploration
Click events allow users to interact further by filtering, zooming, or highlighting data:
- Listen for one-click events on the bar or circle elements on the chart.
- With D3.js transitions, update the visualization dynamically as the clicked data point changes.
- Change the style properties of the clicked element to highlight it.
Advanced Visualization Techniques with D3.js
Developers now have a solid set of tools in D3.js to create complex and stylish visualizations of hierarchical and network data. These advanced techniques allow for a much deeper exploration of datasets and support for effective storytelling and analysis.
Hierarchical Data Visualizations
- Tree Maps: The data hierarchies are displayed as nested rectangles, where size and color represent different attributes.
- Sunburst Charts: Radial layout for showing hierarchical relationships with proportions.
- Example: A tree map can show the department sizes of a company’s organizational structure.
Force-Directed Graphs for Network Data
- Using D3.js's force simulation API, an interactive network graph can be created. The graph represents nodes, links, entities, and their connections.
- Realistic layouts can be obtained with customizable forces such as collision detection and link strength.
Code Snippet:
const simulation = d3.forceSimulation(nodes)
.force("link", d3.forceLink(links).distance(50))
.force("charge", d3.forceManyBody().strength(-30))
.force("center", d3.forceCenter(width / 2, height / 2))
.on("tick", ticked);
function ticked() {
d3.selectAll("circle").attr("cx", d => d.x).attr("cy", d => d.y);
d3.selectAll("line").attr("x1", d => d.source.x).attr("y1", d => d.source.y)
.attr("x2", d => d.target.x).attr("y2", d => d.target.y);
}
Optimizing Performance for Large Datasets
- Use canvas rendering instead of SVG for data-heavy visualizations.
- Aggregation and sampling make it easy to use simpler datasets, making it more responsive.
Integrating D3.js Visualizations with Web Frameworks
Combining D3.js visualizations with modern web frameworks equips both tools with newfound interactivity while leveraging the latter's strengths. D3.js is great at making and manipulating scalable vector graphics (SVG), but web frameworks offer structure and state management for large applications. Together, these offer seamless and dynamic user experiences.
Key Steps to Integrate D3.js Visualizations:
- Data Binding and Rendering: D3.js handles data manipulation and visualization logic. The web framework handles data fetching and application state, while D3.js renders visuals in specific DOM elements marked up as intended for visualization.
- Componentization: A D3.js visualizations encapsulated into reusable components. It allows maintenance and easier integration of it within bigger projects.
- Lifecycle Management: Use D3.js functionality in application lifecycle hooks (e.g., mounting or updating). Ensure the DOM is completely rendered, as D3.js has yet to work on it.
- CSS and Styling: D3.js is also used to make super-precision adjustments to SVG elements but keep in mind to apply styles through the framework's CSS systems.
Example Workflow:
- Define a container in your application for the visualization (e.g., a <div> or <svg> element).
- Trigger the rendering of D3.js through the framework's lifecycle hooks.
- Bind data and draw the chart on the container D3.js will listen to.
- Using D3.js, we respond to user interactions by updating the state of the framework and re-rendering it.
Best Practices for Designing Effective Data Visualizations
Creating data visualizations with D3.js is a craft that needs planning, design principles that aid clarity and engagement, and a lot of code. Below are some best practices to consider:
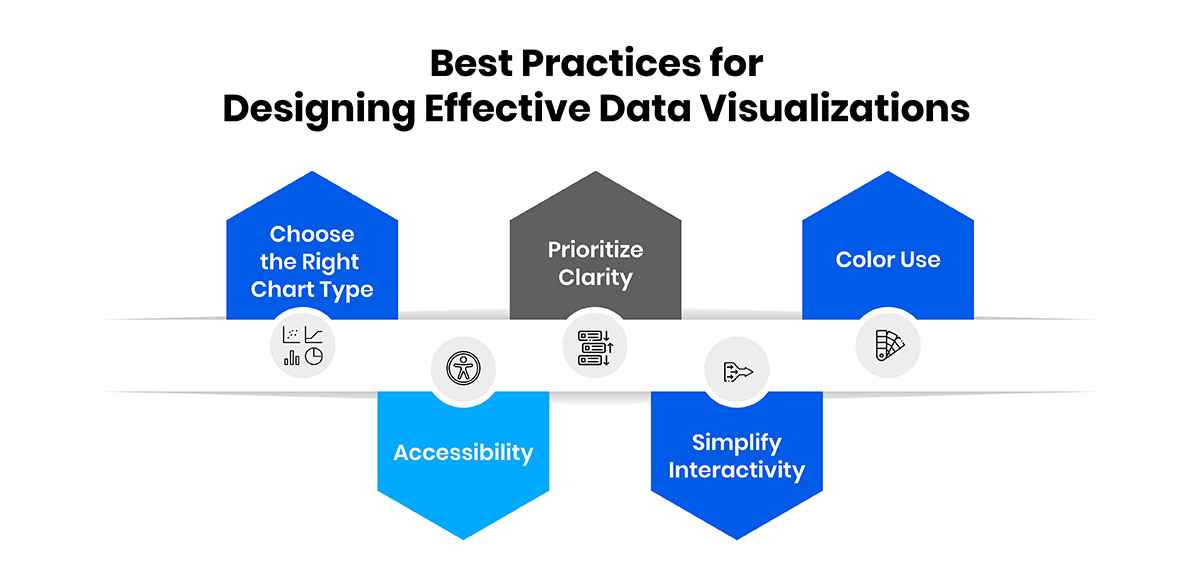
- Choose the Right Chart Type: Select the visualization type that best visualizes the data. Bar charts are good for comparison, whereas line charts are great for trends over time. Keep visuals clutter-free and free of unnecessary detail.
- Prioritize Clarity: Labels, axes, and legends should be unambiguous. Concise text and intuitive scales should make the visualization self-explanatory.
- Color Use: Use color wisely ― to highlight patterns or distinctions. Keep in mind that you shouldn’t use drastic, highly expansive colors that overpower your readers.
- Accessibility: Include alt text, readable fonts, and colorblind-friendly palettes in your visualizations for everyone to consume.
- Simplify Interactivity: The tooltips or zoom features should be intuitive and add value without confusing the user.
Conclusion
Data visualization with D3.js enables developers to learn and master beautiful, interactive data visualizations for the craft communication of complex information. Using its principles, through animations and interactivity, and with a few simple best practices, you can produce engaging and insightful visualizations that appeal to different audiences. With D3.js, you have so much flexibility — it allows you to handle all sorts of data and design requirements — that you can’t use it when doing modern, impactful visual storytelling.


